Single Cluster Open Source Observability - Java Monitoring
Objective
This pattern demonstrates how to use the New EKS Cluster Open Source Observability Accelerator with Java based workloads.
It also enables control plane logging for comprehensive monitoring on the EKS cluster.
Prerequisites
Ensure that you have installed the following tools on your machine.
Deploying
Please follow the Deploying instructions of the New EKS Cluster Open Source Observability Accelerator pattern, except for step 7, where you need to replace "context" in ~/.cdk.json with the following:
  "context": {
    "fluxRepository": {
      "name": "grafana-dashboards",
      "namespace": "grafana-operator",
      "repository": {
        "repoUrl": "https://github.com/aws-observability/aws-observability-accelerator",
        "name": "grafana-dashboards",
        "targetRevision": "main",
        "path": "./artifacts/grafana-operator-manifests/eks/infrastructure"
      },
      "values": {
        "GRAFANA_CLUSTER_DASH_URL" : "https://raw.githubusercontent.com/aws-observability/aws-observability-accelerator/main/artifacts/grafana-dashboards/eks/infrastructure/cluster.json",
        "GRAFANA_KUBELET_DASH_URL" : "https://raw.githubusercontent.com/aws-observability/aws-observability-accelerator/main/artifacts/grafana-dashboards/eks/infrastructure/kubelet.json",
        "GRAFANA_NSWRKLDS_DASH_URL" : "https://raw.githubusercontent.com/aws-observability/aws-observability-accelerator/main/artifacts/grafana-dashboards/eks/infrastructure/namespace-workloads.json",
        "GRAFANA_NODEEXP_DASH_URL" : "https://raw.githubusercontent.com/aws-observability/aws-observability-accelerator/main/artifacts/grafana-dashboards/eks/infrastructure/nodeexporter-nodes.json",
        "GRAFANA_NODES_DASH_URL" : "https://raw.githubusercontent.com/aws-observability/aws-observability-accelerator/main/artifacts/grafana-dashboards/eks/infrastructure/nodes.json",
        "GRAFANA_WORKLOADS_DASH_URL" : "https://raw.githubusercontent.com/aws-observability/aws-observability-accelerator/main/artifacts/grafana-dashboards/eks/infrastructure/workloads.json",
        "GRAFANA_JAVA_JMX_DASH_URL" : "https://raw.githubusercontent.com/aws-observability/aws-observability-accelerator/main/artifacts/grafana-dashboards/eks/java/default.json",
        "GRAFANA_KSH_DASH_URL" : "https://raw.githubusercontent.com/aws-observability/aws-observability-accelerator/main/artifacts/grafana-dashboards/eks/infrastructure/ksh.json",
        "GRAFANA_KCM_DASH_URL" : "https://raw.githubusercontent.com/aws-observability/aws-observability-accelerator/main/artifacts/grafana-dashboards/eks/infrastructure/kcm.json"
      },
      "kustomizations": [
        {
          "kustomizationPath": "./artifacts/grafana-operator-manifests/eks/infrastructure"
        },
        {
          "kustomizationPath": "./artifacts/grafana-operator-manifests/eks/java"
        }
      ]
    },
    "java.pattern.enabled": true
  }
Once completed the rest of the Deploying steps, you can move on with the deployment of the Java workload.
Deploy an example Java application
In this section we will reuse an example from the AWS OpenTelemetry collector repository. For convenience, the steps can be found below.
-
Clone this repository and navigate to the
sample-apps/jmx/directory. -
Authenticate to Amazon ECR (AWS_REGION was set during the deployment stage)
export AWS_ACCOUNT_ID=`aws sts get-caller-identity --query Account --output text`
aws ecr get-login-password --region $AWS_REGION | docker login --username AWS --password-stdin $AWS_ACCOUNT_ID.dkr.ecr.$AWS_REGION.amazonaws.com
- Create an Amazon ECR repository
aws ecr create-repository --repository-name prometheus-sample-tomcat-jmx \
  --image-scanning-configuration scanOnPush=true \
  --region $AWS_REGION
- Build Docker image and push to ECR.
docker build -t $AWS_ACCOUNT_ID.dkr.ecr.$AWS_REGION.amazonaws.com/prometheus-sample-tomcat-jmx:latest .
docker push $AWS_ACCOUNT_ID.dkr.ecr.$AWS_REGION.amazonaws.com/prometheus-sample-tomcat-jmx:latest
- Install the sample application in the cluster
SAMPLE_TRAFFIC_NAMESPACE=javajmx-sample
curl https://raw.githubusercontent.com/aws-observability/aws-otel-test-framework/terraform/sample-apps/jmx/examples/prometheus-metrics-sample.yaml |
sed "s/{{aws_account_id}}/$AWS_ACCOUNT_ID/g" |
sed "s/{{region}}/$AWS_REGION/g" |
sed "s/{{namespace}}/$SAMPLE_TRAFFIC_NAMESPACE/g" |
kubectl apply -f -
Verify the resources
kubectl get pods -n $SAMPLE_TRAFFIC_NAMESPACE

NAME                              READY   STATUS    RESTARTS   AGE
tomcat-bad-traffic-generator      1/1     Running   0          90m
tomcat-example-77b46cc546-z22jf   1/1     Running   0          25m
tomcat-traffic-generator          1/1     Running   0          90m
Visualization
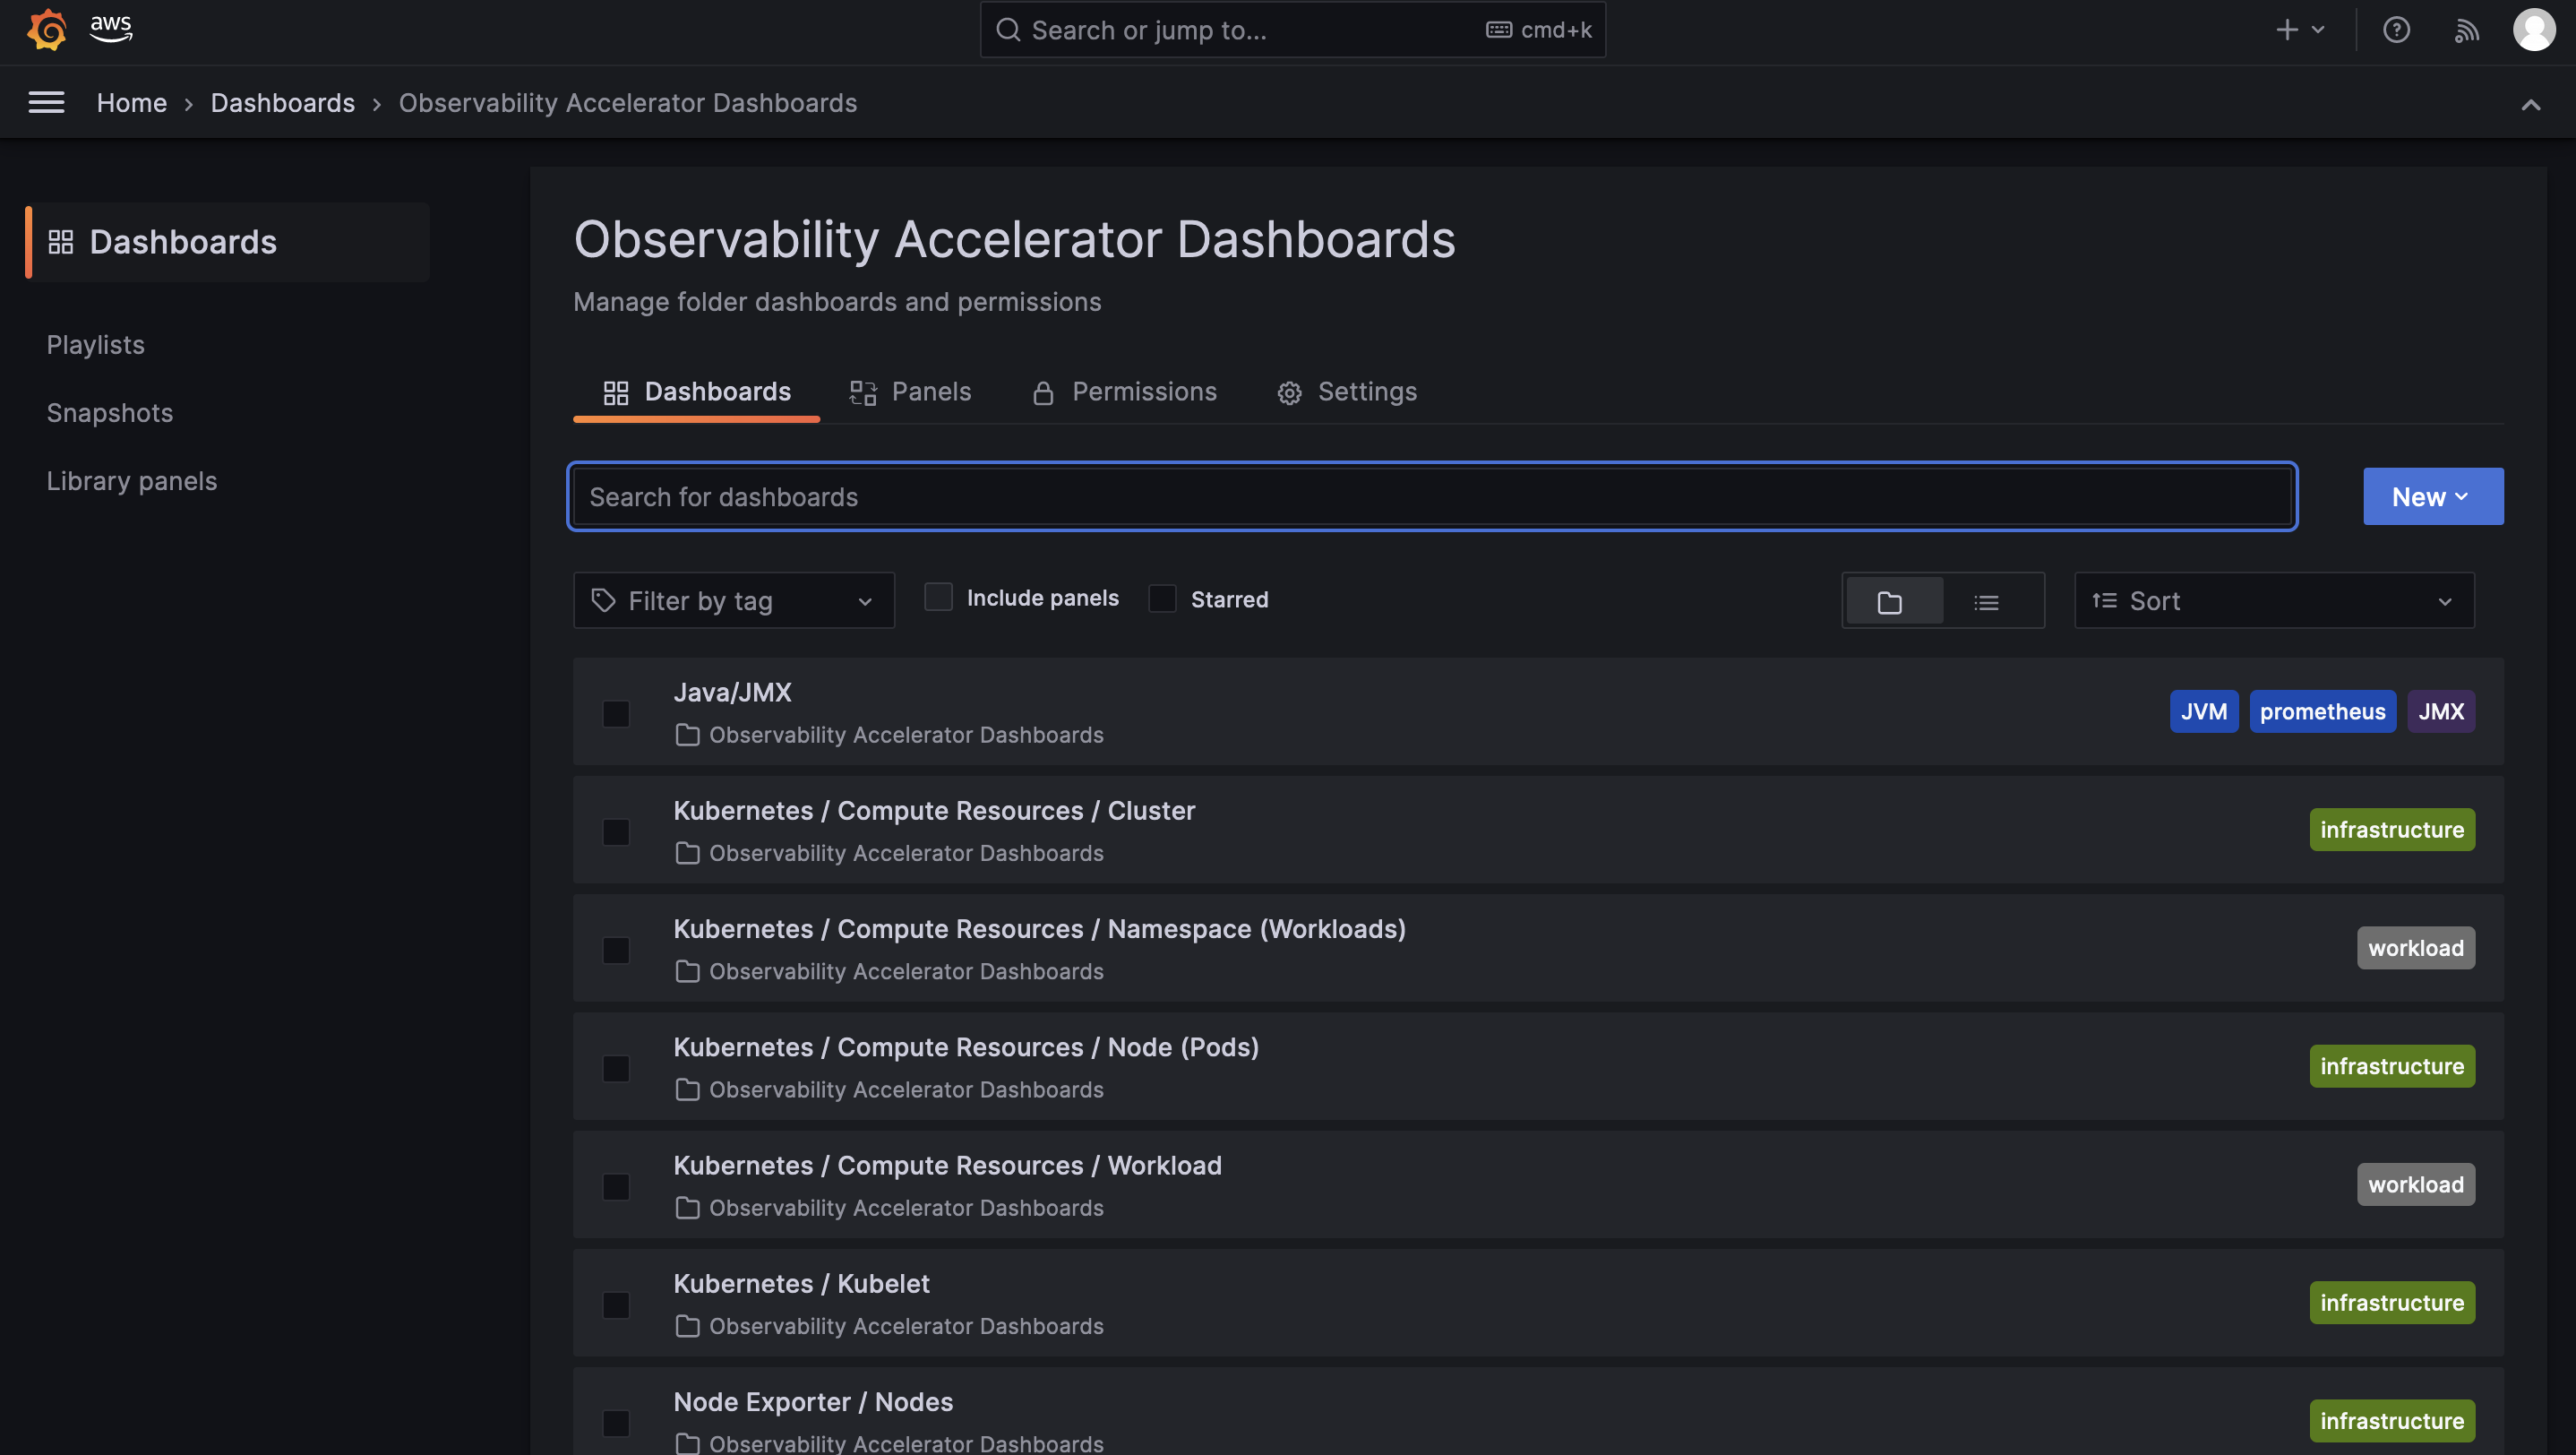
Login to your Grafana workspace and navigate to the Dashboards panel. You should see a new dashboard named Java/JMX, under Observability Accelerator Dashboards:
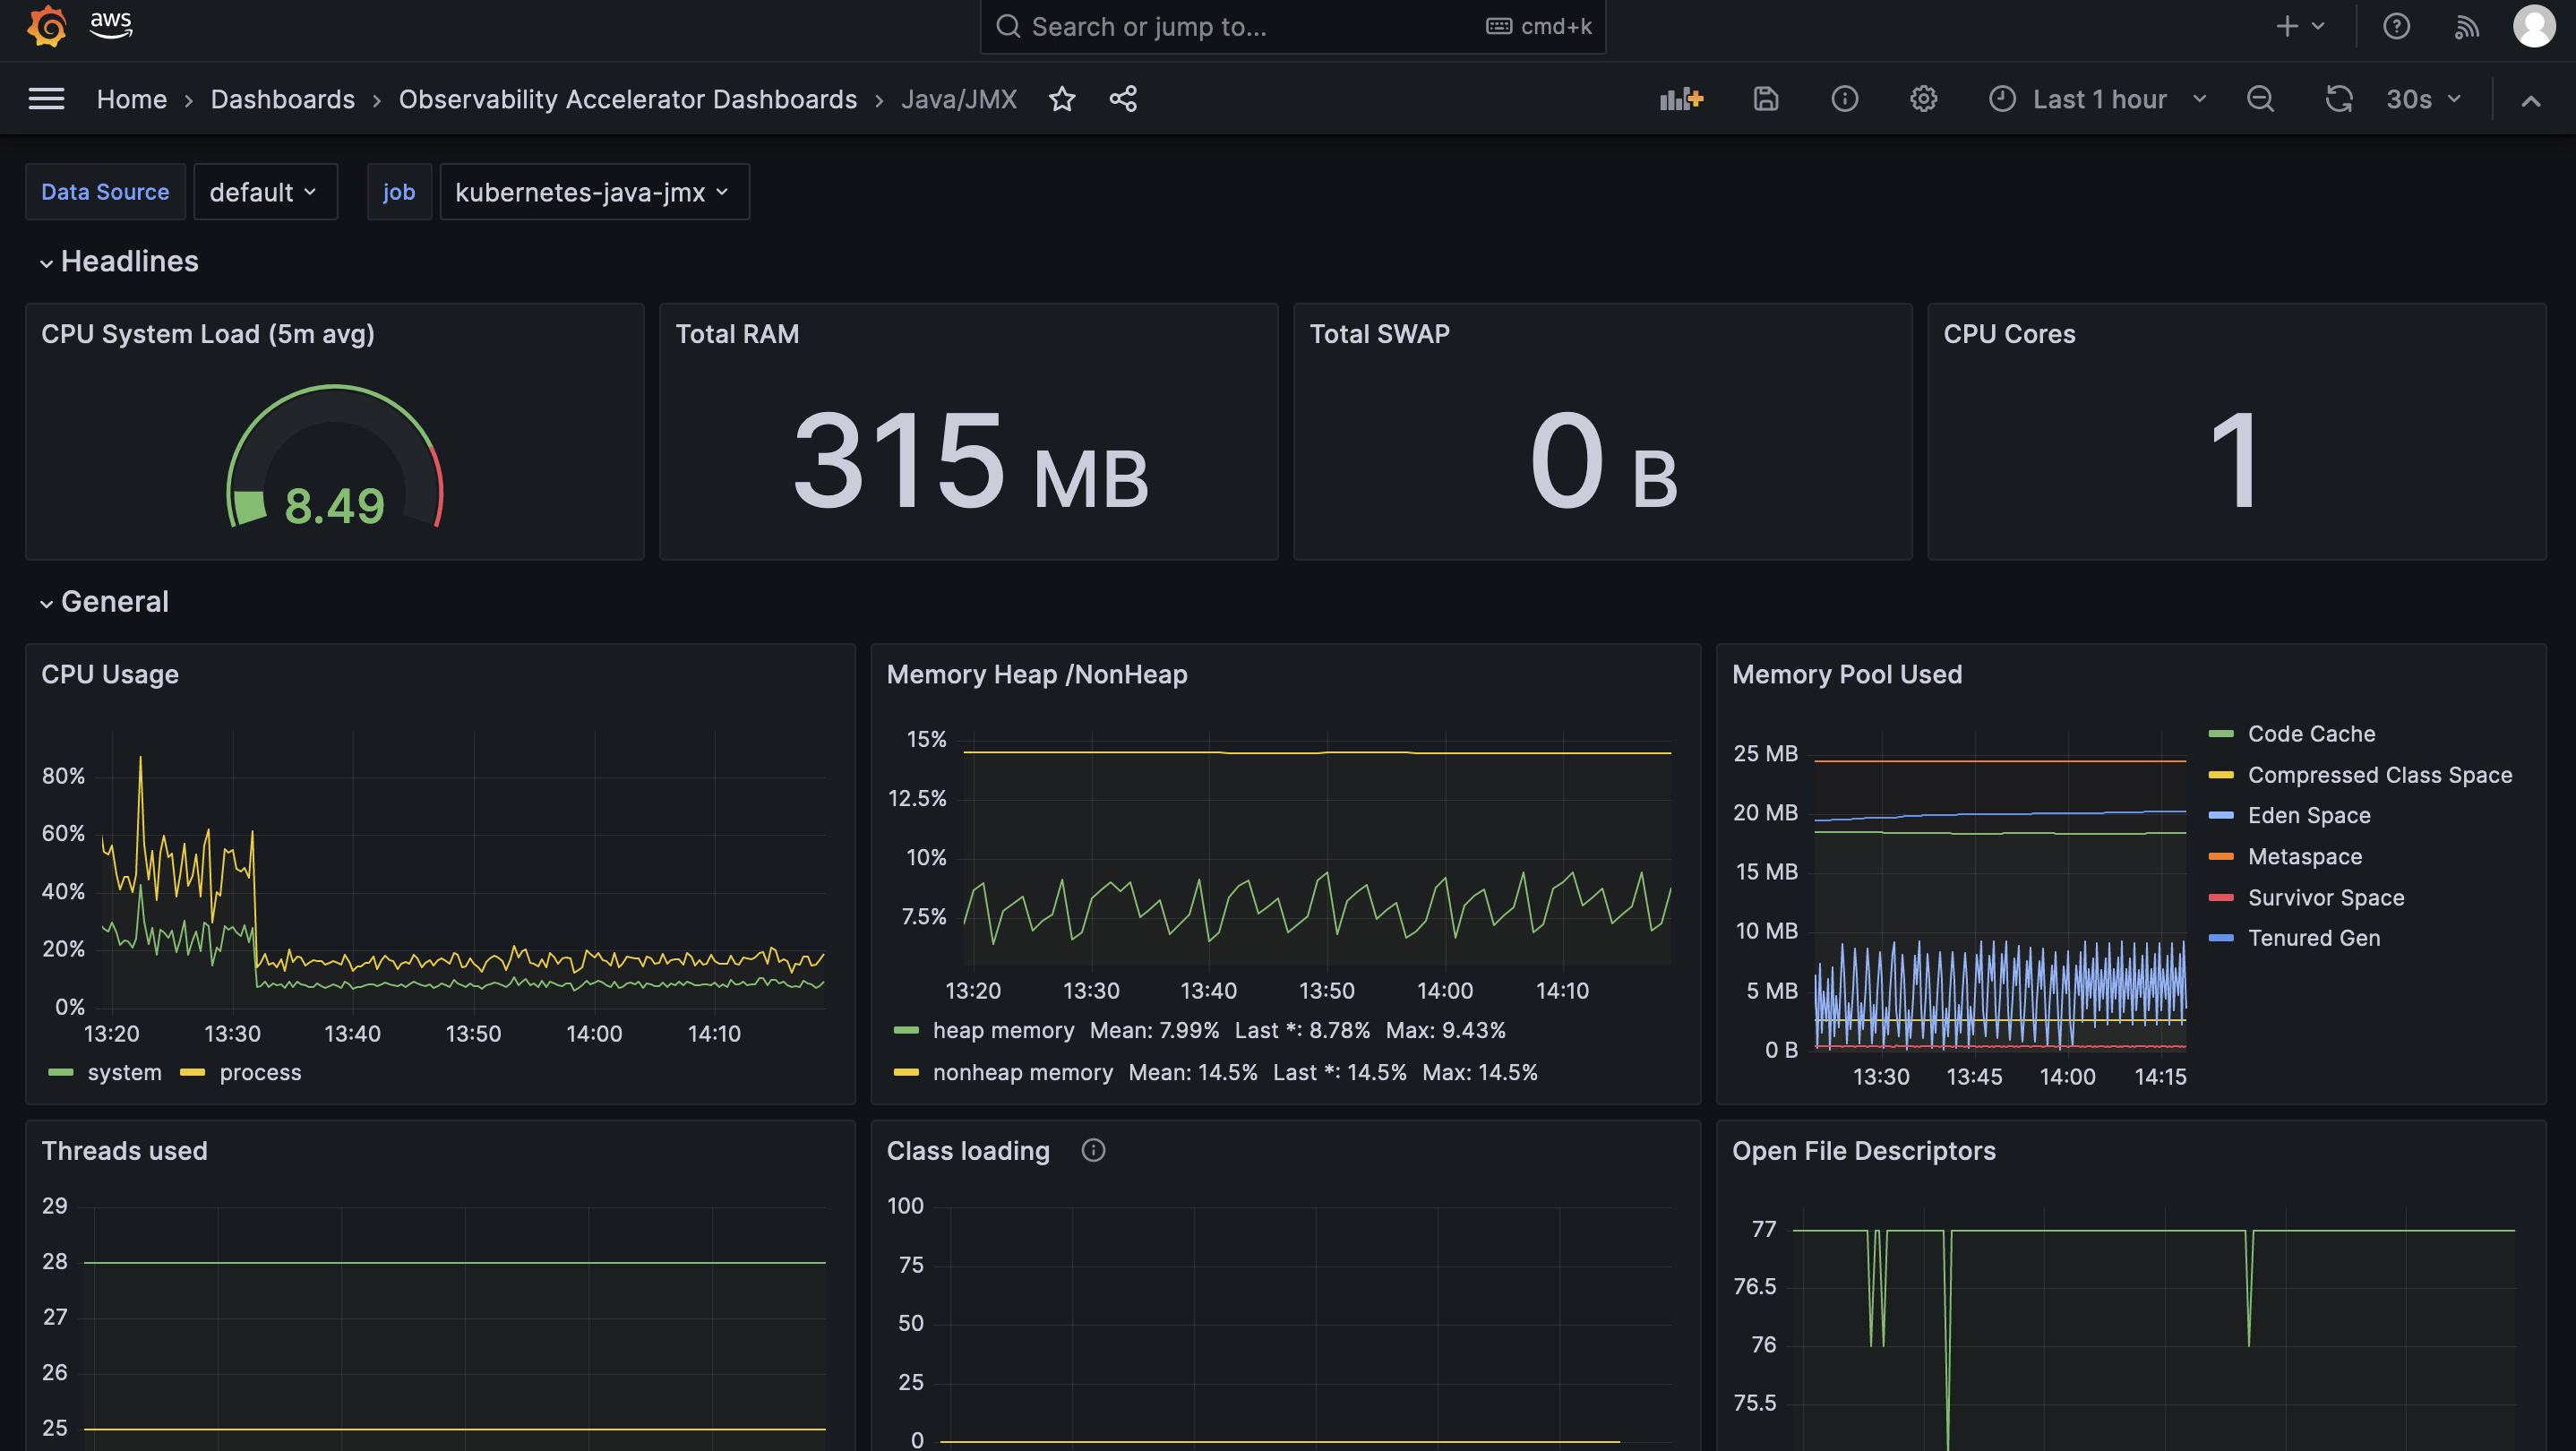
Open the Java/JMX dashboard and you should be able to view its visualization as shown below:
Teardown
You can teardown the whole CDK stack with the following command:
make pattern single-new-eks-opensource-observability destroy