Single Cluster Open Source Observability - Container Logs Collection
Objective
Following the announcement of logs support in AWS Distro for OpenTelemetry, this pattern demonstrates how to use the New EKS Cluster Open Source Observability Accelerator to forward container logs to cloud watch using ADOT containers log collector.
Prerequisites
Ensure that you have installed the following tools on your machine.
Deploying
Please follow the Deploying instructions of the New EKS Cluster Open Source Observability Accelerator pattern, except for step 7, where you need to replace "context" in ~/.cdk.json with the following:
  "context": {
    "fluxRepository": {
      "name": "grafana-dashboards",
      "namespace": "grafana-operator",
      "repository": {
        "repoUrl": "https://github.com/aws-observability/aws-observability-accelerator",
        "name": "grafana-dashboards",
        "targetRevision": "main",
        "path": "./artifacts/grafana-operator-manifests/eks/infrastructure"
      },
      "values": {
        "GRAFANA_CLUSTER_DASH_URL" : "https://raw.githubusercontent.com/aws-observability/aws-observability-accelerator/main/artifacts/grafana-dashboards/eks/infrastructure/cluster.json",
        "GRAFANA_KUBELET_DASH_URL" : "https://raw.githubusercontent.com/aws-observability/aws-observability-accelerator/main/artifacts/grafana-dashboards/eks/infrastructure/kubelet.json",
        "GRAFANA_NSWRKLDS_DASH_URL" : "https://raw.githubusercontent.com/aws-observability/aws-observability-accelerator/main/artifacts/grafana-dashboards/eks/infrastructure/namespace-workloads.json",
        "GRAFANA_NODEEXP_DASH_URL" : "https://raw.githubusercontent.com/aws-observability/aws-observability-accelerator/main/artifacts/grafana-dashboards/eks/infrastructure/nodeexporter-nodes.json",
        "GRAFANA_NODES_DASH_URL" : "https://raw.githubusercontent.com/aws-observability/aws-observability-accelerator/main/artifacts/grafana-dashboards/eks/infrastructure/nodes.json",
        "GRAFANA_WORKLOADS_DASH_URL" : "https://raw.githubusercontent.com/aws-observability/aws-observability-accelerator/main/artifacts/grafana-dashboards/eks/infrastructure/workloads.json",
        "GRAFANA_KSH_DASH_URL" : "https://raw.githubusercontent.com/aws-observability/aws-observability-accelerator/main/artifacts/grafana-dashboards/eks/infrastructure/ksh.json",
        "GRAFANA_KCM_DASH_URL" : "https://raw.githubusercontent.com/aws-observability/aws-observability-accelerator/main/artifacts/grafana-dashboards/eks/infrastructure/kcm.json"
      },
      "kustomizations": [
        {
          "kustomizationPath": "./artifacts/grafana-operator-manifests/eks/infrastructure"
        }
      ]
    },
    "adotcontainerlogs.pattern.enabled": true
  }
!! warning This scenario might need larger worker node for the pod.
Once completed the rest of the Deploying steps, you can move on with the deployment of the Nginx workload.
Viewing Logs in CloudWatch Log Groups and Logs Insights
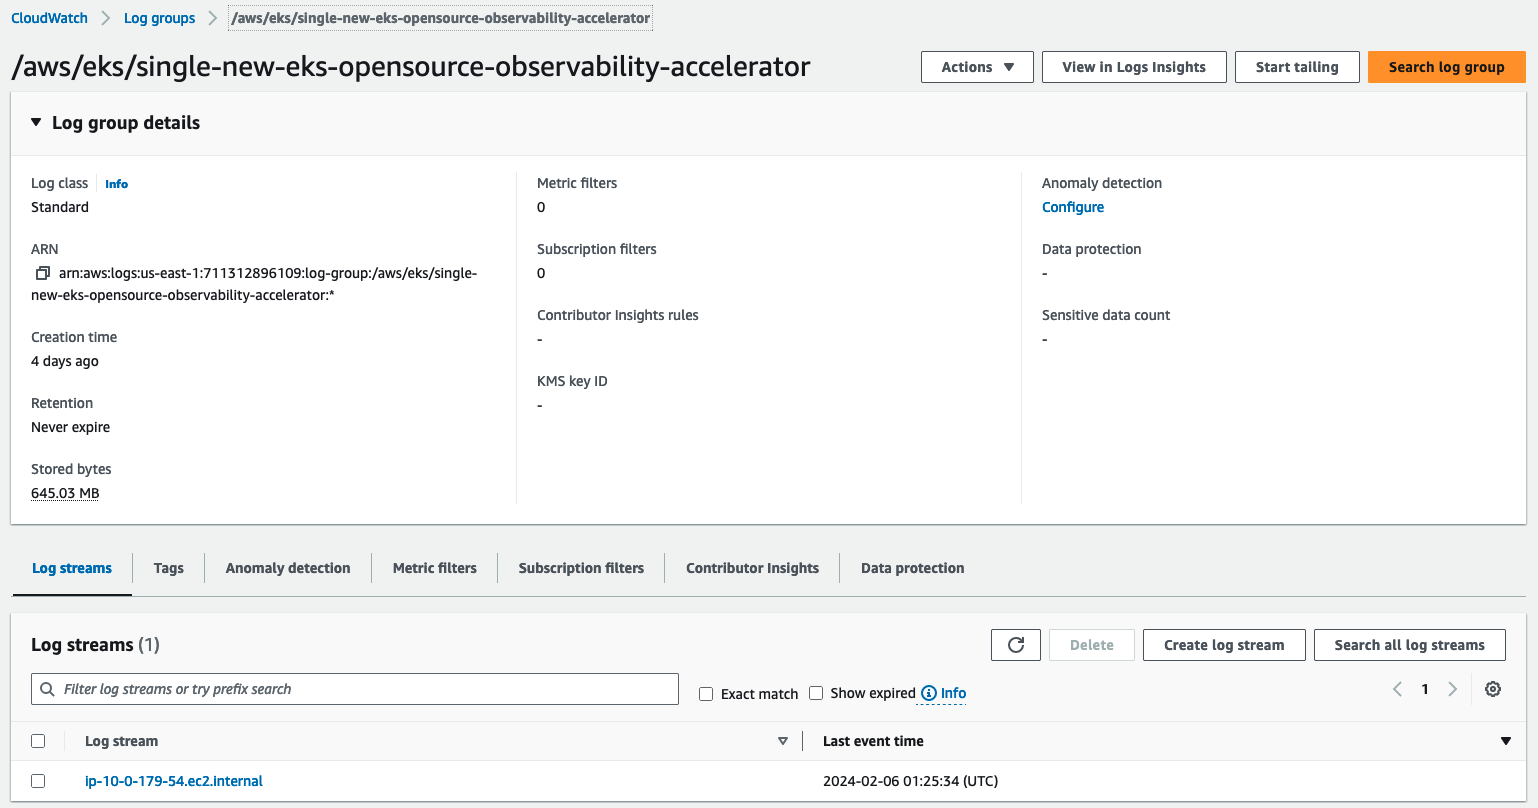
Navigate to CloudWatch, then go to "Log groups"
Search for log group with the name "/aws/eks/single-new-eks-mixed-observability-accelerator" and open it
You will see log streams created using the node name

Open the log stream and you view the logs forwarded by the container logs collector to CloudWatch

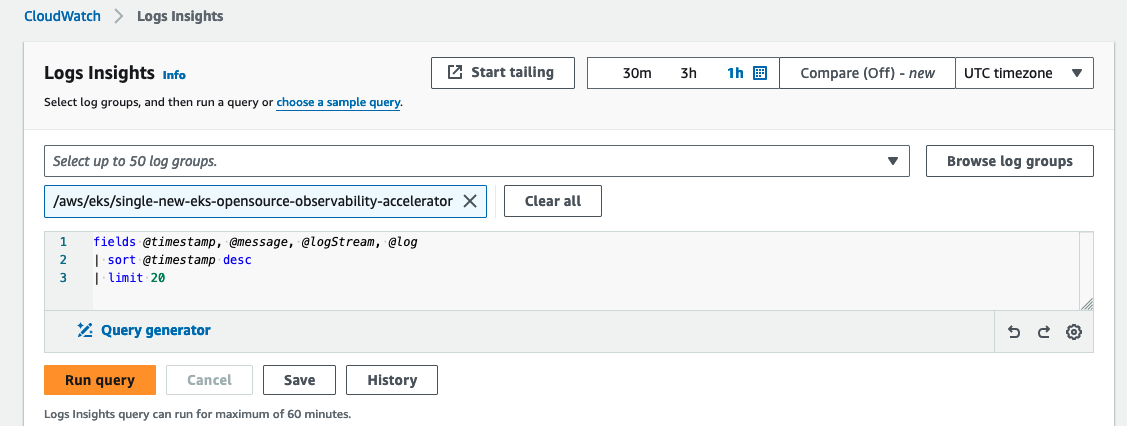
Navigate to CloudWatch, then go to "Logs Insights"
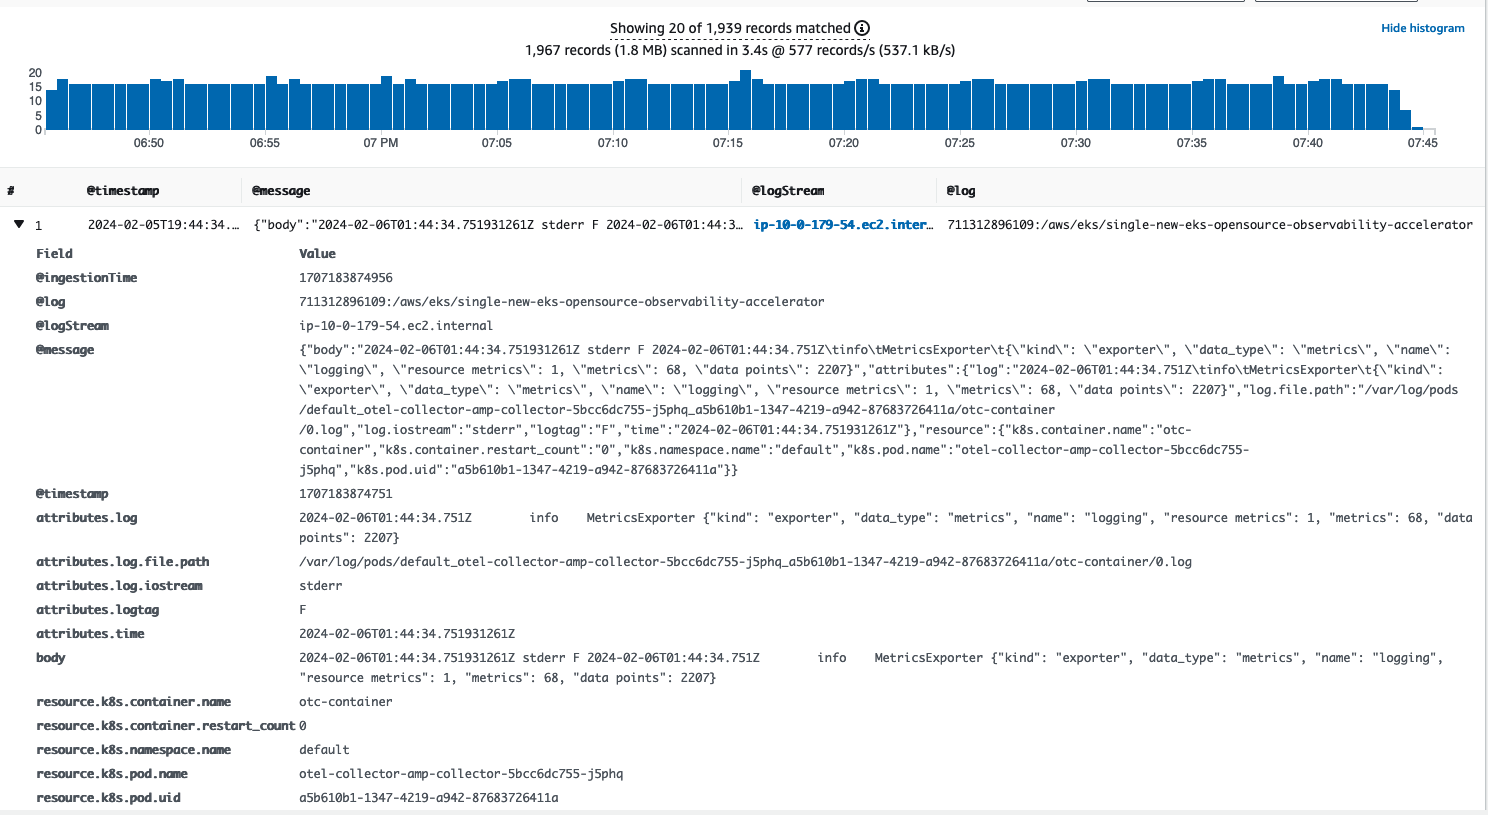
In the dropdown, select log group with name "/aws/eks/single-new-eks-mixed-observability-accelerator" and run a query.

Then you can view the results of your query:

Teardown
You can teardown the whole CDK stack with the following command:
make pattern single-new-eks-opensource-observability destroy