Single Cluster Open Source Observability - Graviton
Architecture
The following figure illustrates the architecture of the pattern we will be deploying for Single EKS Cluster Open Source Observability on Graviton pattern using open source tooling such as AWS Distro for Open Telemetry (ADOT), Amazon Managed Service for Prometheus and Amazon Managed Grafana:
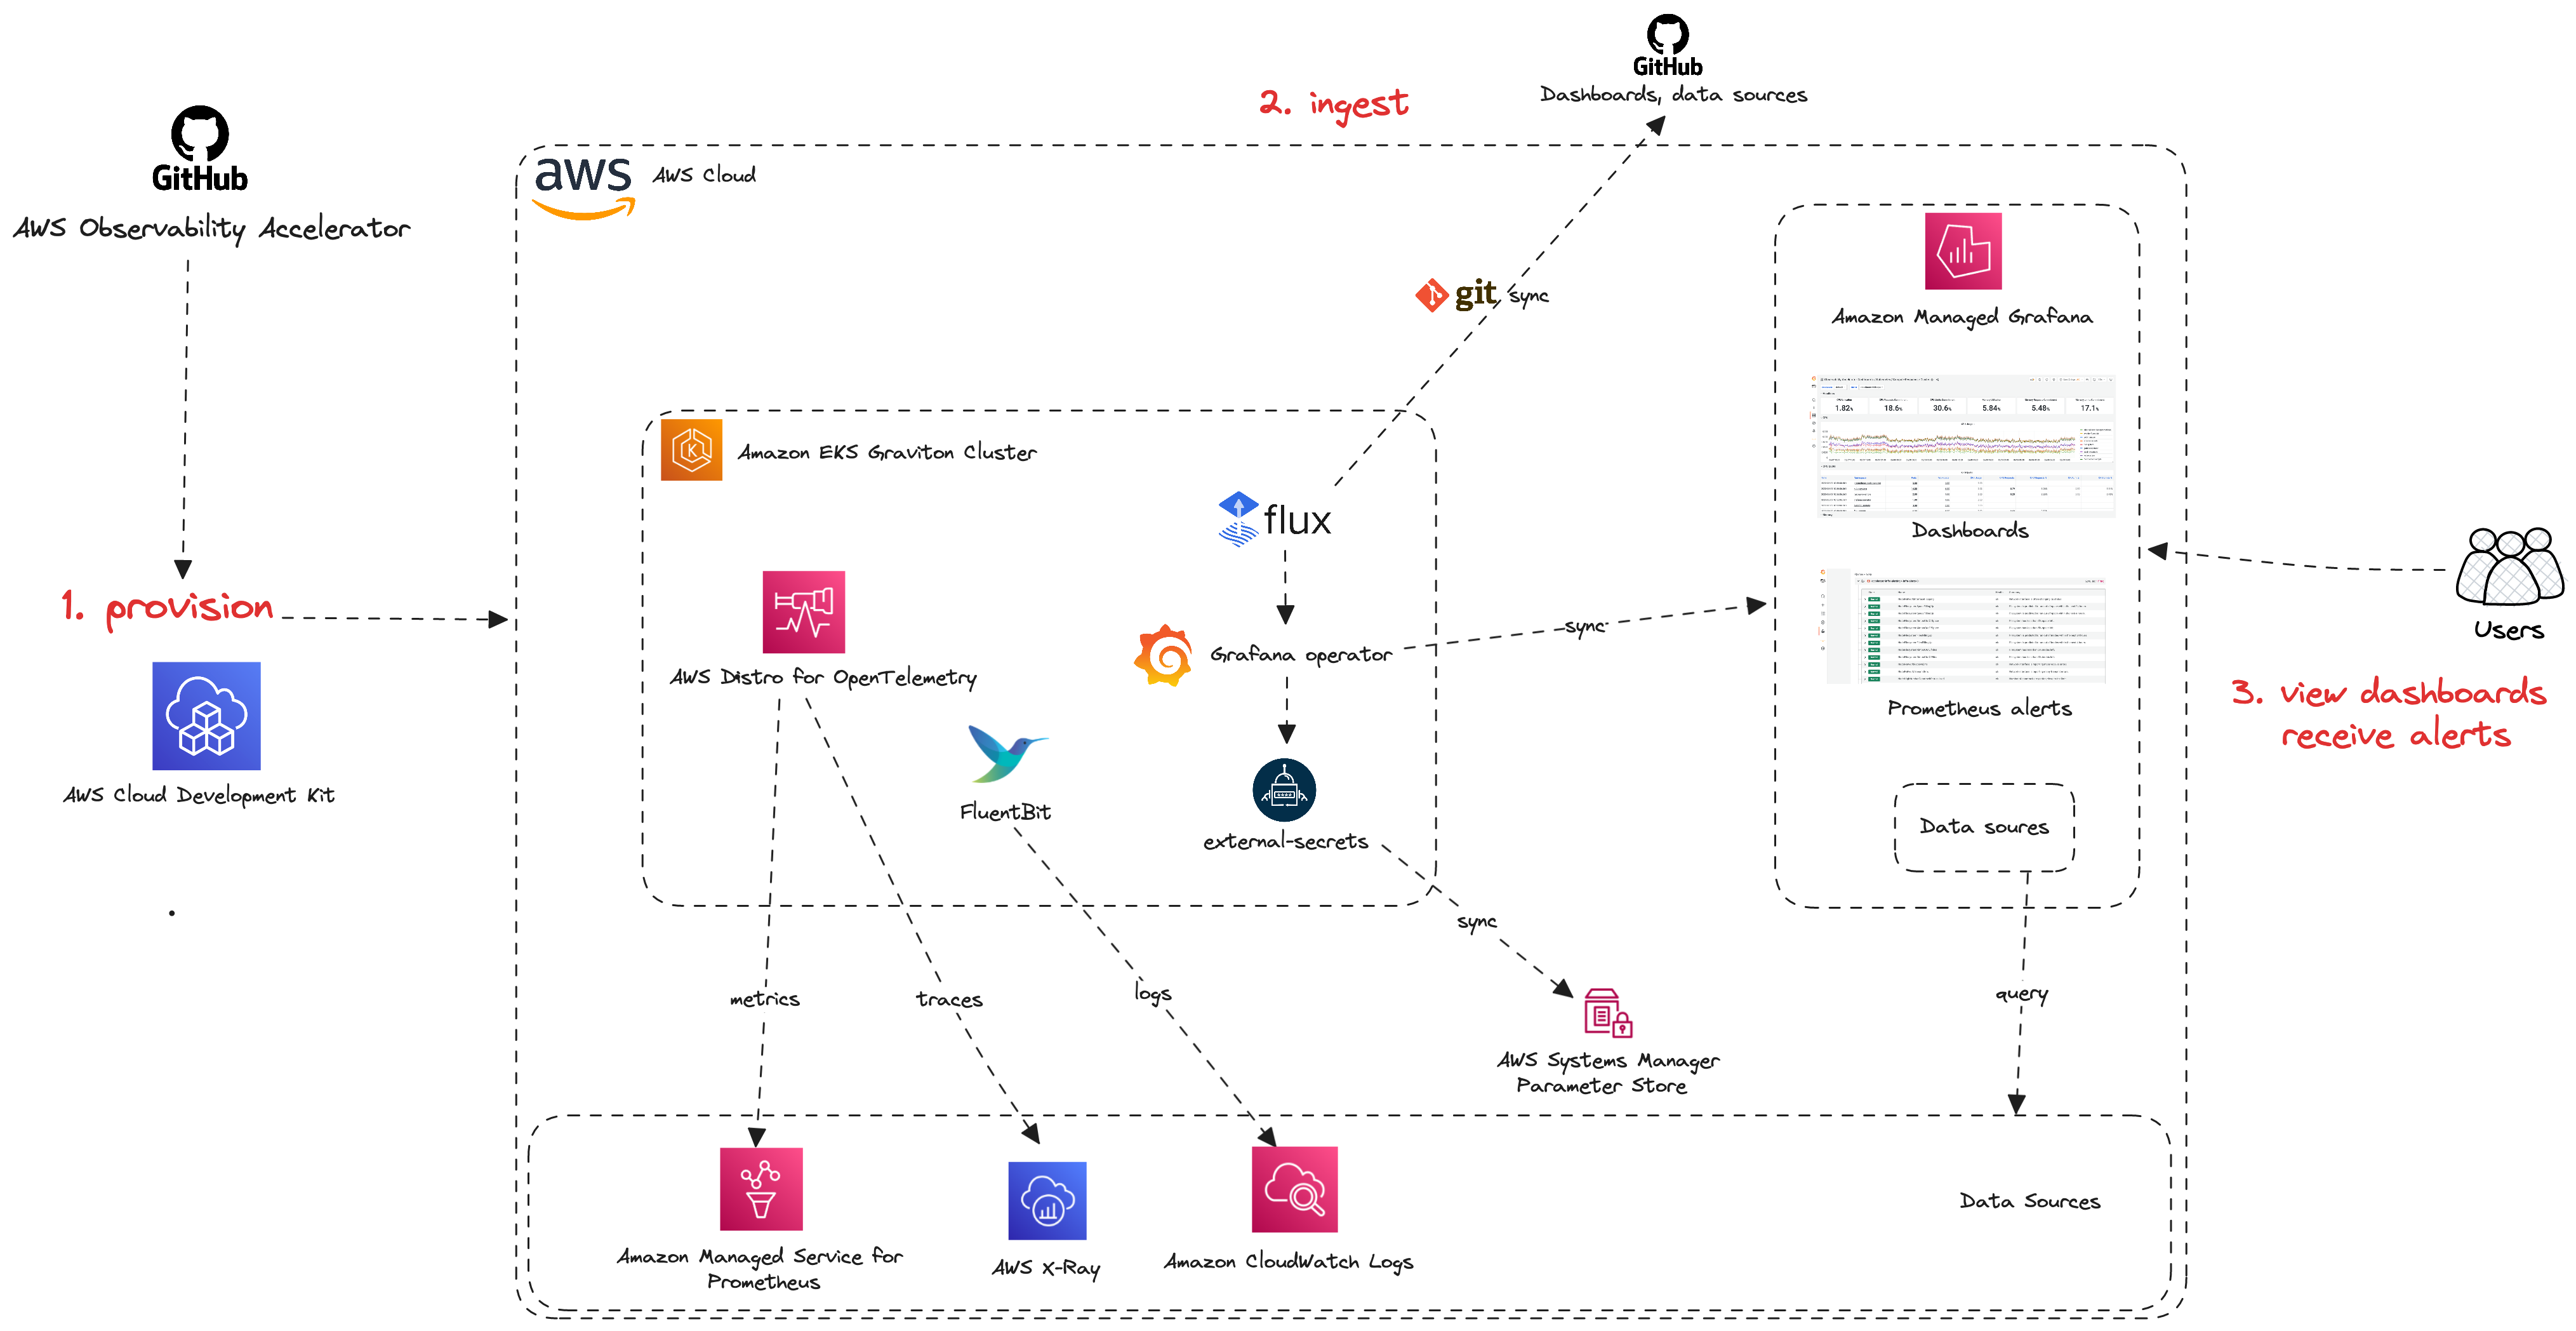
Monitoring Amazon Elastic Kubernetes Service (Amazon EKS) for metrics has two categories: the control plane and the Amazon EKS nodes (with Kubernetes objects). The Amazon EKS control plane consists of control plane nodes that run the Kubernetes software, such as etcd and the Kubernetes API server. To read more on the components of an Amazon EKS cluster, please read the service documentation.
Graviton
AWS Graviton Processors are designed by AWS to deliver the best price to performance for your cloud workloads running in Amazon EC2. These processors are ARM chips running on aarch64 architecture. These processors feature key capabilities, such as the AWS Nitro System, that allow you to securely run cloud native applications at scale.
Visit our EKS Blueprints docs for a list of supported addons on Graviton.
Objective
- Deploys one production grade Amazon EKS cluster running on a Graviton3 Processor
- Enables control plane logging
- AWS Distro For OpenTelemetry Operator and Collector for Metrics and Traces
- Logs with AWS for FluentBit
- Installs Grafana Operator to add AWS data sources and create Grafana Dashboards to Amazon Managed Grafana.
- Installs FluxCD to perform GitOps sync of a Git Repo to EKS Cluster. We will use this later for creating Grafana Dashboards and AWS datasources to Amazon Managed Grafana. You can also use your own GitRepo to sync your own Grafana resources such as Dashboards, Datasources etc. Please check our One observability module - GitOps with Amazon Managed Grafana to learn more about this.
- Installs External Secrets Operator to retrieve and Sync the Grafana API keys.
- Amazon Managed Grafana Dashboard and data source
- Alerts and recording rules with Amazon Managed Service for Prometheus
Prerequisites:
Ensure that you have installed the following tools on your machine.
Deploying
- Clone your forked repository
git clone https://github.com/aws-observability/cdk-aws-observability-accelerator.git
- Install the AWS CDK Toolkit globally on your machine using
npm install -g aws-cdk
- Amazon Managed Grafana workspace: To visualize metrics collected, you need an Amazon Managed Grafana workspace. If you have an existing workspace, create an environment variable as described below. To create a new workspace, visit our supporting example for Grafana
Note
For the URL https://g-xyz.grafana-workspace.us-east-1.amazonaws.com, the workspace ID would be g-xyz
export AWS_REGION=<YOUR AWS REGION>
export COA_AMG_WORKSPACE_ID=g-xxx
export COA_AMG_ENDPOINT_URL=https://g-xyz.grafana-workspace.us-east-1.amazonaws.com
Warning
Setting up environment variables COA_AMG_ENDPOINT_URL and AWS_REGION is mandatory for successful execution of this pattern.
- GRAFANA API KEY: Amazon Managed Grafana provides a control plane API for generating Grafana API keys or Service Account Tokens.
# IMPORTANT NOTE: skip this command if you already have a service token
GRAFANA_SA_ID=$(aws grafana create-workspace-service-account \
  --workspace-id $COA_AMG_WORKSPACE_ID \
  --grafana-role ADMIN \
  --name cdk-accelerator-eks \
  --query 'id' \
  --output text)

# creates a new token
export AMG_API_KEY=$(aws grafana create-workspace-service-account-token \
  --workspace-id $COA_AMG_WORKSPACE_ID \
  -name "grafana-operator-key" \
  --seconds-to-live 432000 \
  --service-account-id $GRAFANA_SA_ID \
  --query 'serviceAccountToken.key' \
  --output text)
export AMG_API_KEY=$(aws grafana create-workspace-api-key \
  --key-name "grafana-operator-key" \
  --key-role "ADMIN" \
  --seconds-to-live 432000 \
  --workspace-id $COA_AMG_WORKSPACE_ID \
  --query key \
  --output text)
- AWS Secrets Manager for GRAFANA API KEY: Update the Grafana API key secret in AWS Secrets using the above new Grafana API key. This will be referenced by Grafana Operator deployment of our solution to access Amazon Managed Grafana from Amazon EKS Cluster
aws secretsmanager create-secret \
    --name grafana-api-key \
    --description "API Key of your Grafana Instance" \
    --secret-string "${AMG_API_KEY}" \
    --region $AWS_REGION \
    --query ARN \
    --output text
-
Install project dependencies by running
npm installin the main folder of this cloned repository. -
The actual settings for dashboard urls are expected to be specified in the CDK context. Generically it is inside the cdk.json file of the current directory or in
~/.cdk.jsonin your home directory.
Example settings: Update the context in cdk.json file located in cdk-eks-blueprints-patterns directory
  "context": {
    "fluxRepository": {
      "name": "grafana-dashboards",
      "namespace": "grafana-operator",
      "repository": {
        "repoUrl": "https://github.com/aws-observability/aws-observability-accelerator",
        "name": "grafana-dashboards",
        "targetRevision": "main",
        "path": "./artifacts/grafana-operator-manifests/eks/infrastructure"
      },
      "values": {
        "GRAFANA_CLUSTER_DASH_URL" : "https://raw.githubusercontent.com/aws-observability/aws-observability-accelerator/main/artifacts/grafana-dashboards/eks/infrastructure/cluster.json",
        "GRAFANA_KUBELET_DASH_URL" : "https://raw.githubusercontent.com/aws-observability/aws-observability-accelerator/main/artifacts/grafana-dashboards/eks/infrastructure/kubelet.json",
        "GRAFANA_NSWRKLDS_DASH_URL" : "https://raw.githubusercontent.com/aws-observability/aws-observability-accelerator/main/artifacts/grafana-dashboards/eks/infrastructure/namespace-workloads.json",
        "GRAFANA_NODEEXP_DASH_URL" : "https://raw.githubusercontent.com/aws-observability/aws-observability-accelerator/main/artifacts/grafana-dashboards/eks/infrastructure/nodeexporter-nodes.json",
        "GRAFANA_NODES_DASH_URL" : "https://raw.githubusercontent.com/aws-observability/aws-observability-accelerator/main/artifacts/grafana-dashboards/eks/infrastructure/nodes.json",
        "GRAFANA_WORKLOADS_DASH_URL" : "https://raw.githubusercontent.com/aws-observability/aws-observability-accelerator/main/artifacts/grafana-dashboards/eks/infrastructure/workloads.json",
        "GRAFANA_KSH_DASH_URL" : "https://raw.githubusercontent.com/aws-observability/aws-observability-accelerator/main/artifacts/grafana-dashboards/eks/infrastructure/ksh.json",
        "GRAFANA_KCM_DASH_URL" : "https://raw.githubusercontent.com/aws-observability/aws-observability-accelerator/main/artifacts/grafana-dashboards/eks/infrastructure/kcm.json"
      },
      "kustomizations": [
        {
          "kustomizationPath": "./artifacts/grafana-operator-manifests/eks/infrastructure"
        }
      ]
    },
  }
If you need Java observability you can instead use:
  "context": {
    "fluxRepository": {
      "name": "grafana-dashboards",
      "namespace": "grafana-operator",
      "repository": {
        "repoUrl": "https://github.com/aws-observability/aws-observability-accelerator",
        "name": "grafana-dashboards",
        "targetRevision": "main",
        "path": "./artifacts/grafana-operator-manifests/eks/infrastructure"
      },
      "values": {
        "GRAFANA_CLUSTER_DASH_URL" : "https://raw.githubusercontent.com/aws-observability/aws-observability-accelerator/main/artifacts/grafana-dashboards/eks/infrastructure/cluster.json",
        "GRAFANA_KUBELET_DASH_URL" : "https://raw.githubusercontent.com/aws-observability/aws-observability-accelerator/main/artifacts/grafana-dashboards/eks/infrastructure/kubelet.json",
        "GRAFANA_NSWRKLDS_DASH_URL" : "https://raw.githubusercontent.com/aws-observability/aws-observability-accelerator/main/artifacts/grafana-dashboards/eks/infrastructure/namespace-workloads.json",
        "GRAFANA_NODEEXP_DASH_URL" : "https://raw.githubusercontent.com/aws-observability/aws-observability-accelerator/main/artifacts/grafana-dashboards/eks/infrastructure/nodeexporter-nodes.json",
        "GRAFANA_NODES_DASH_URL" : "https://raw.githubusercontent.com/aws-observability/aws-observability-accelerator/main/artifacts/grafana-dashboards/eks/infrastructure/nodes.json",
        "GRAFANA_WORKLOADS_DASH_URL" : "https://raw.githubusercontent.com/aws-observability/aws-observability-accelerator/main/artifacts/grafana-dashboards/eks/infrastructure/workloads.json",
        "GRAFANA_JAVA_JMX_DASH_URL" : "https://raw.githubusercontent.com/aws-observability/aws-observability-accelerator/main/artifacts/grafana-dashboards/eks/java/default.json",
        "GRAFANA_KSH_DASH_URL" : "https://raw.githubusercontent.com/aws-observability/aws-observability-accelerator/main/artifacts/grafana-dashboards/eks/infrastructure/ksh.json",
        "GRAFANA_KCM_DASH_URL" : "https://raw.githubusercontent.com/aws-observability/aws-observability-accelerator/main/artifacts/grafana-dashboards/eks/infrastructure/kcm.json"
      },
      "kustomizations": [
        {
          "kustomizationPath": "./artifacts/grafana-operator-manifests/eks/infrastructure"
        },
        {
          "kustomizationPath": "./artifacts/grafana-operator-manifests/eks/java"
        }
      ]
    },
    "java.pattern.enabled": true
  }
If you want to deploy API Server dashboards along with Java observability you can instead use:
  "context": {
    "fluxRepository": {
      "name": "grafana-dashboards",
      "namespace": "grafana-operator",
      "repository": {
        "repoUrl": "https://github.com/aws-observability/aws-observability-accelerator",
        "name": "grafana-dashboards",
        "targetRevision": "main",
        "path": "./artifacts/grafana-operator-manifests/eks/infrastructure"
      },
      "values": {
        "GRAFANA_CLUSTER_DASH_URL" : "https://raw.githubusercontent.com/aws-observability/aws-observability-accelerator/main/artifacts/grafana-dashboards/eks/infrastructure/cluster.json",
        "GRAFANA_KUBELET_DASH_URL" : "https://raw.githubusercontent.com/aws-observability/aws-observability-accelerator/main/artifacts/grafana-dashboards/eks/infrastructure/kubelet.json",
        "GRAFANA_NSWRKLDS_DASH_URL" : "https://raw.githubusercontent.com/aws-observability/aws-observability-accelerator/main/artifacts/grafana-dashboards/eks/infrastructure/namespace-workloads.json",
        "GRAFANA_NODEEXP_DASH_URL" : "https://raw.githubusercontent.com/aws-observability/aws-observability-accelerator/main/artifacts/grafana-dashboards/eks/infrastructure/nodeexporter-nodes.json",
        "GRAFANA_NODES_DASH_URL" : "https://raw.githubusercontent.com/aws-observability/aws-observability-accelerator/main/artifacts/grafana-dashboards/eks/infrastructure/nodes.json",
        "GRAFANA_WORKLOADS_DASH_URL" : "https://raw.githubusercontent.com/aws-observability/aws-observability-accelerator/main/artifacts/grafana-dashboards/eks/infrastructure/workloads.json",
        "GRAFANA_JAVA_JMX_DASH_URL" : "https://raw.githubusercontent.com/aws-observability/aws-observability-accelerator/main/artifacts/grafana-dashboards/eks/java/default.json",
        "GRAFANA_APISERVER_BASIC_DASH_URL" : "https://raw.githubusercontent.com/aws-observability/aws-observability-accelerator/main/artifacts/grafana-dashboards/eks/apiserver/apiserver-basic.json",
        "GRAFANA_APISERVER_ADVANCED_DASH_URL" : "https://raw.githubusercontent.com/aws-observability/aws-observability-accelerator/main/artifacts/grafana-dashboards/eks/apiserver/apiserver-advanced.json",
        "GRAFANA_APISERVER_TROUBLESHOOTING_DASH_URL" : "https://raw.githubusercontent.com/aws-observability/aws-observability-accelerator/main/artifacts/grafana-dashboards/eks/apiserver/apiserver-troubleshooting.json",
        "GRAFANA_KSH_DASH_URL" : "https://raw.githubusercontent.com/aws-observability/aws-observability-accelerator/main/artifacts/grafana-dashboards/eks/infrastructure/ksh.json",
        "GRAFANA_KCM_DASH_URL" : "https://raw.githubusercontent.com/aws-observability/aws-observability-accelerator/main/artifacts/grafana-dashboards/eks/infrastructure/kcm.json"
      },
      "kustomizations": [
        {
          "kustomizationPath": "./artifacts/grafana-operator-manifests/eks/infrastructure"
        },
        {
          "kustomizationPath": "./artifacts/grafana-operator-manifests/eks/java"
        }
        {
          "kustomizationPath": "./artifacts/grafana-operator-manifests/eks/apiserver"
        }
      ]
    },
    "java.pattern.enabled": true,
    "apiserver.pattern.enabled": true,
  }
- Once all pre-requisites are set you are ready to deploy the pipeline. Run the following command from the root of this repository to deploy the pipeline stack:
make build
make pattern single-new-eks-graviton-opensource-observability deploy
Verify the resources
Run update-kubeconfig command. You should be able to get the command from CDK output message.
aws eks update-kubeconfig --name single-new-eks-graviton-opensource-observability-accelerator --region <your region> --role-arn arn:aws:iam::xxxxxxxxx:role/single-new-eks-gravitonop-singleneweksgravitonopens-82N8N3BMJYYI
Let’s verify the resources created by steps above.
kubectl get nodes -o wide
NAME                                         STATUS   ROLES    AGE    VERSION               INTERNAL-IP    EXTERNAL-IP   OS-IMAGE         KERNEL-VERSION                  CONTAINER-RUNTIME
ip-10-0-104-200.us-west-2.compute.internal   Ready    <none>   2d1h   v1.27.1-eks-2f008fe   10.0.104.200   <none>        Amazon Linux 2   5.10.179-168.710.amzn2.aarch64   containerd://1.6.19
Next, lets verify the namespaces in the cluster:
kubectl get ns # Output shows all namespace
Output:
NAME                            STATUS   AGE
cert-manager                    Active   2d1h
default                         Active   2d1h
external-secrets                Active   2d1h
flux-system                     Active   2d1h
grafana-operator                Active   2d1h
kube-node-lease                 Active   2d1h
kube-public                     Active   2d1h
kube-system                     Active   2d1h
opentelemetry-operator-system   Active   2d1h
prometheus-node-exporter        Active   2d1h
Next, lets verify all resources of grafana-operator namespace:
kubectl get all --namespace=grafana-operator
Output:
NAME                                    READY   STATUS    RESTARTS   AGE
pod/grafana-operator-866d4446bb-g5srl   1/1     Running   0          2d1h

NAME                                       TYPE        CLUSTER-IP       EXTERNAL-IP   PORT(S)    AGE
service/grafana-operator-metrics-service   ClusterIP   172.20.223.125   <none>        9090/TCP   2d1h

NAME                               READY   UP-TO-DATE   AVAILABLE   AGE
deployment.apps/grafana-operator   1/1     1            1           2d1h

NAME                                          DESIRED   CURRENT   READY   AGE
replicaset.apps/grafana-operator-866d4446bb   1         1         1       2d1h
Visualization
1. Grafana dashboards
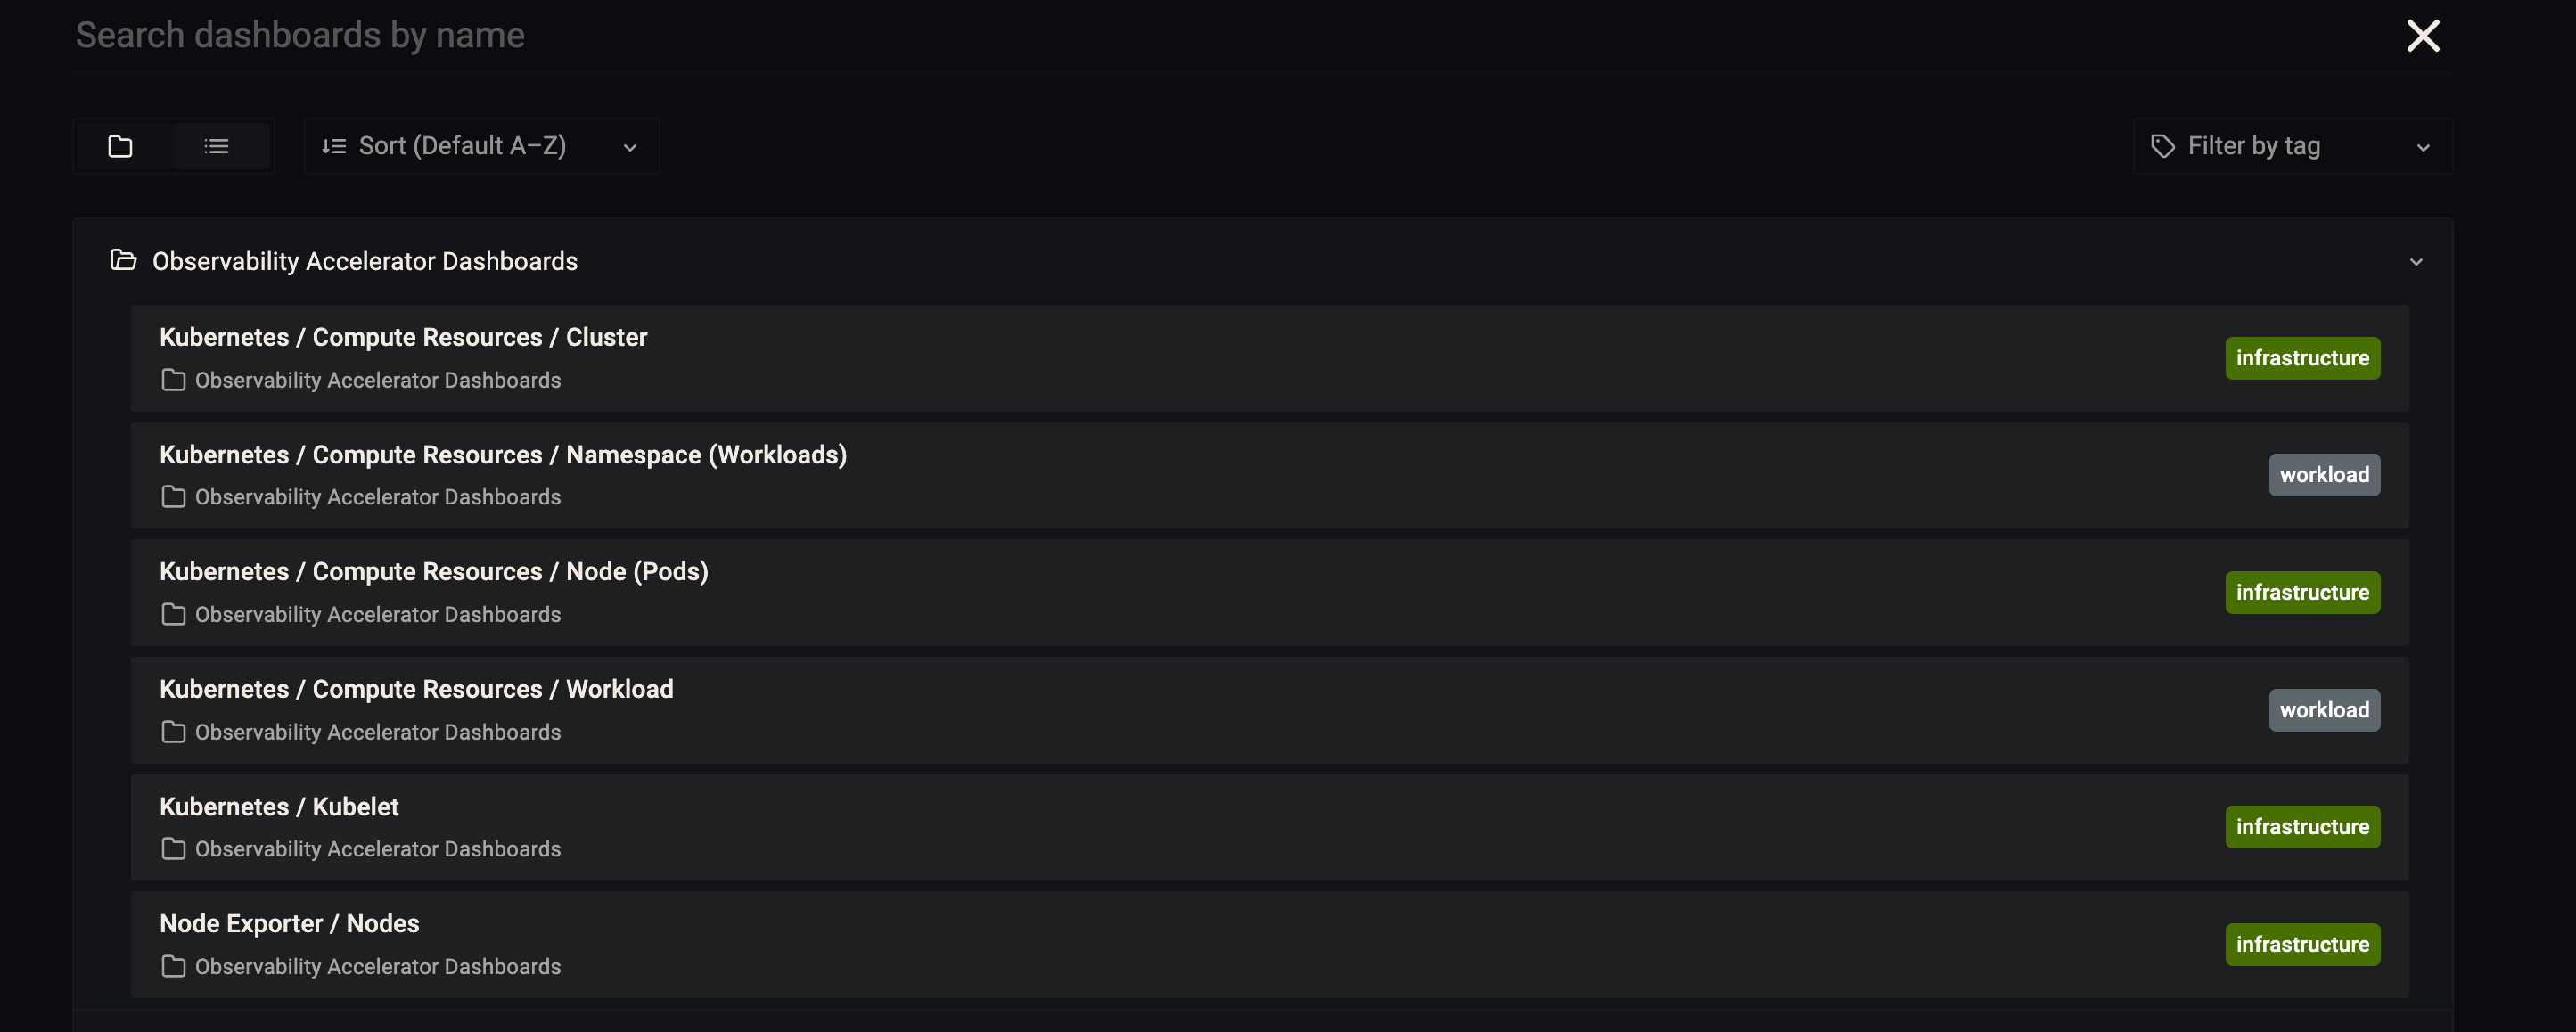
Login to your Grafana workspace and navigate to the Dashboards panel. You should see a list of dashboards under the Observability Accelerator Dashboards
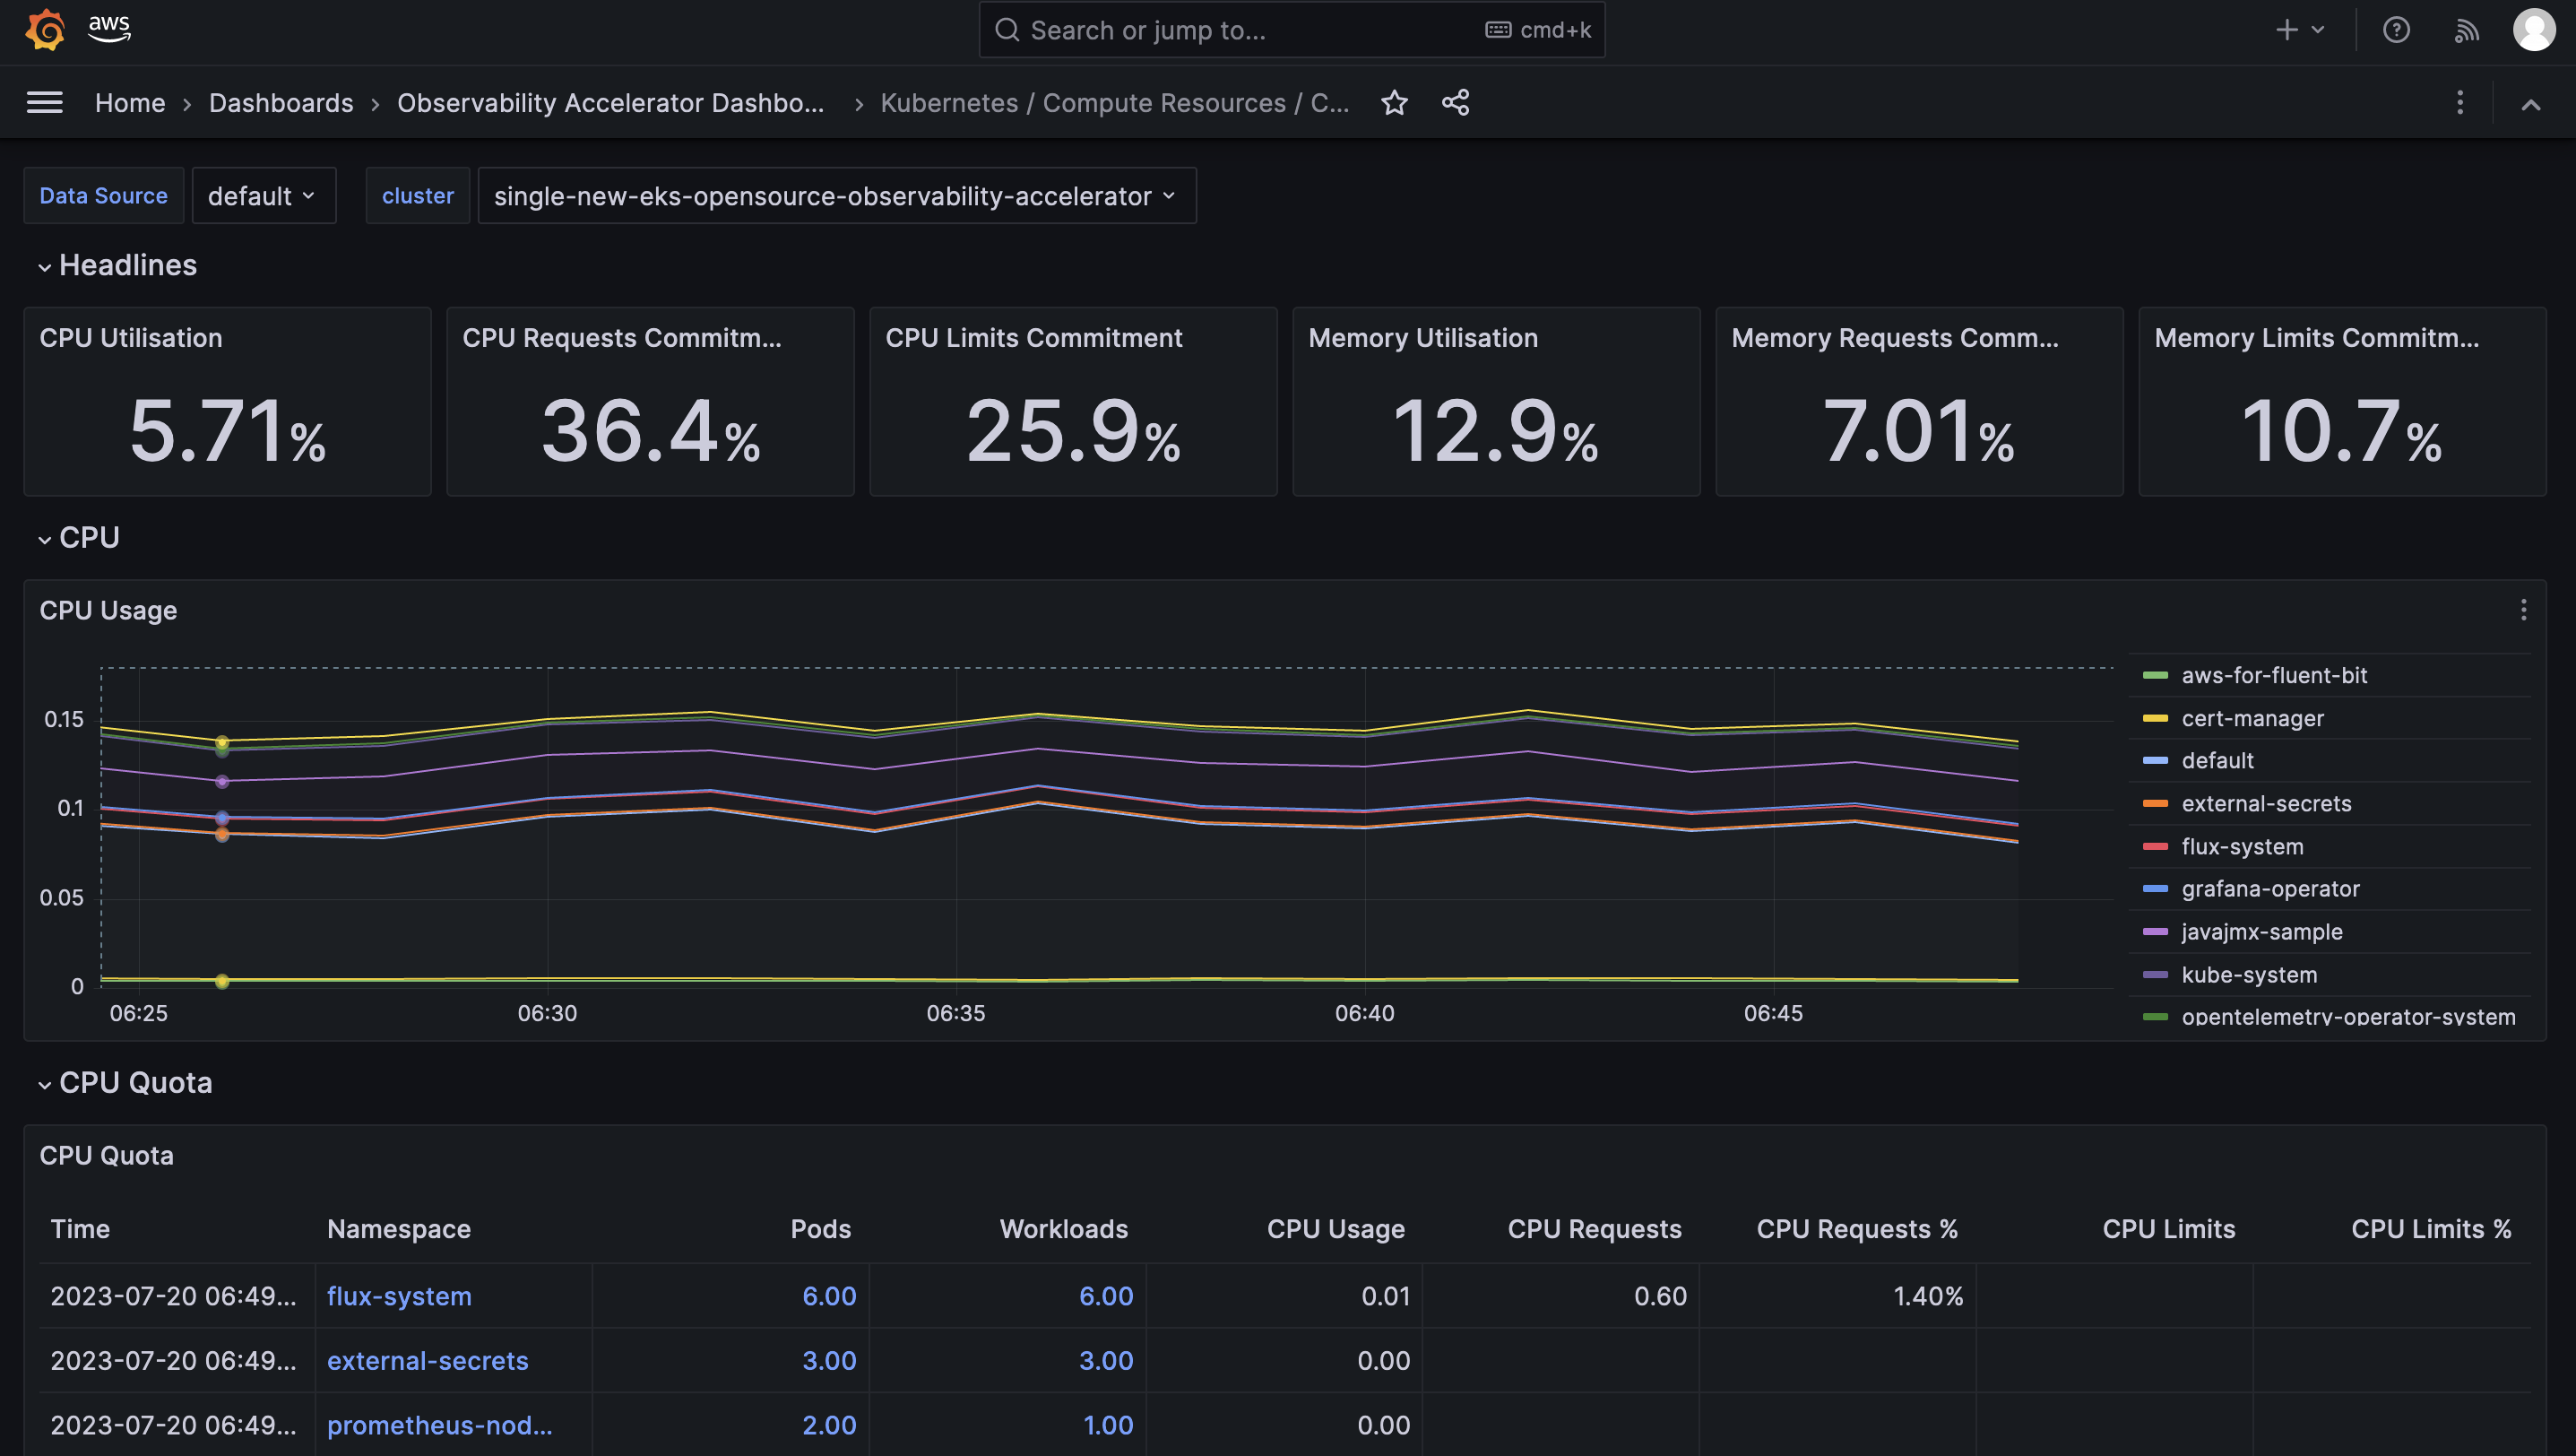
Open the Cluster dashboard and you should be able to view its visualization as shown below :
Open the Namespace (Workloads) dashboard and you should be able to view its visualization as shown below :
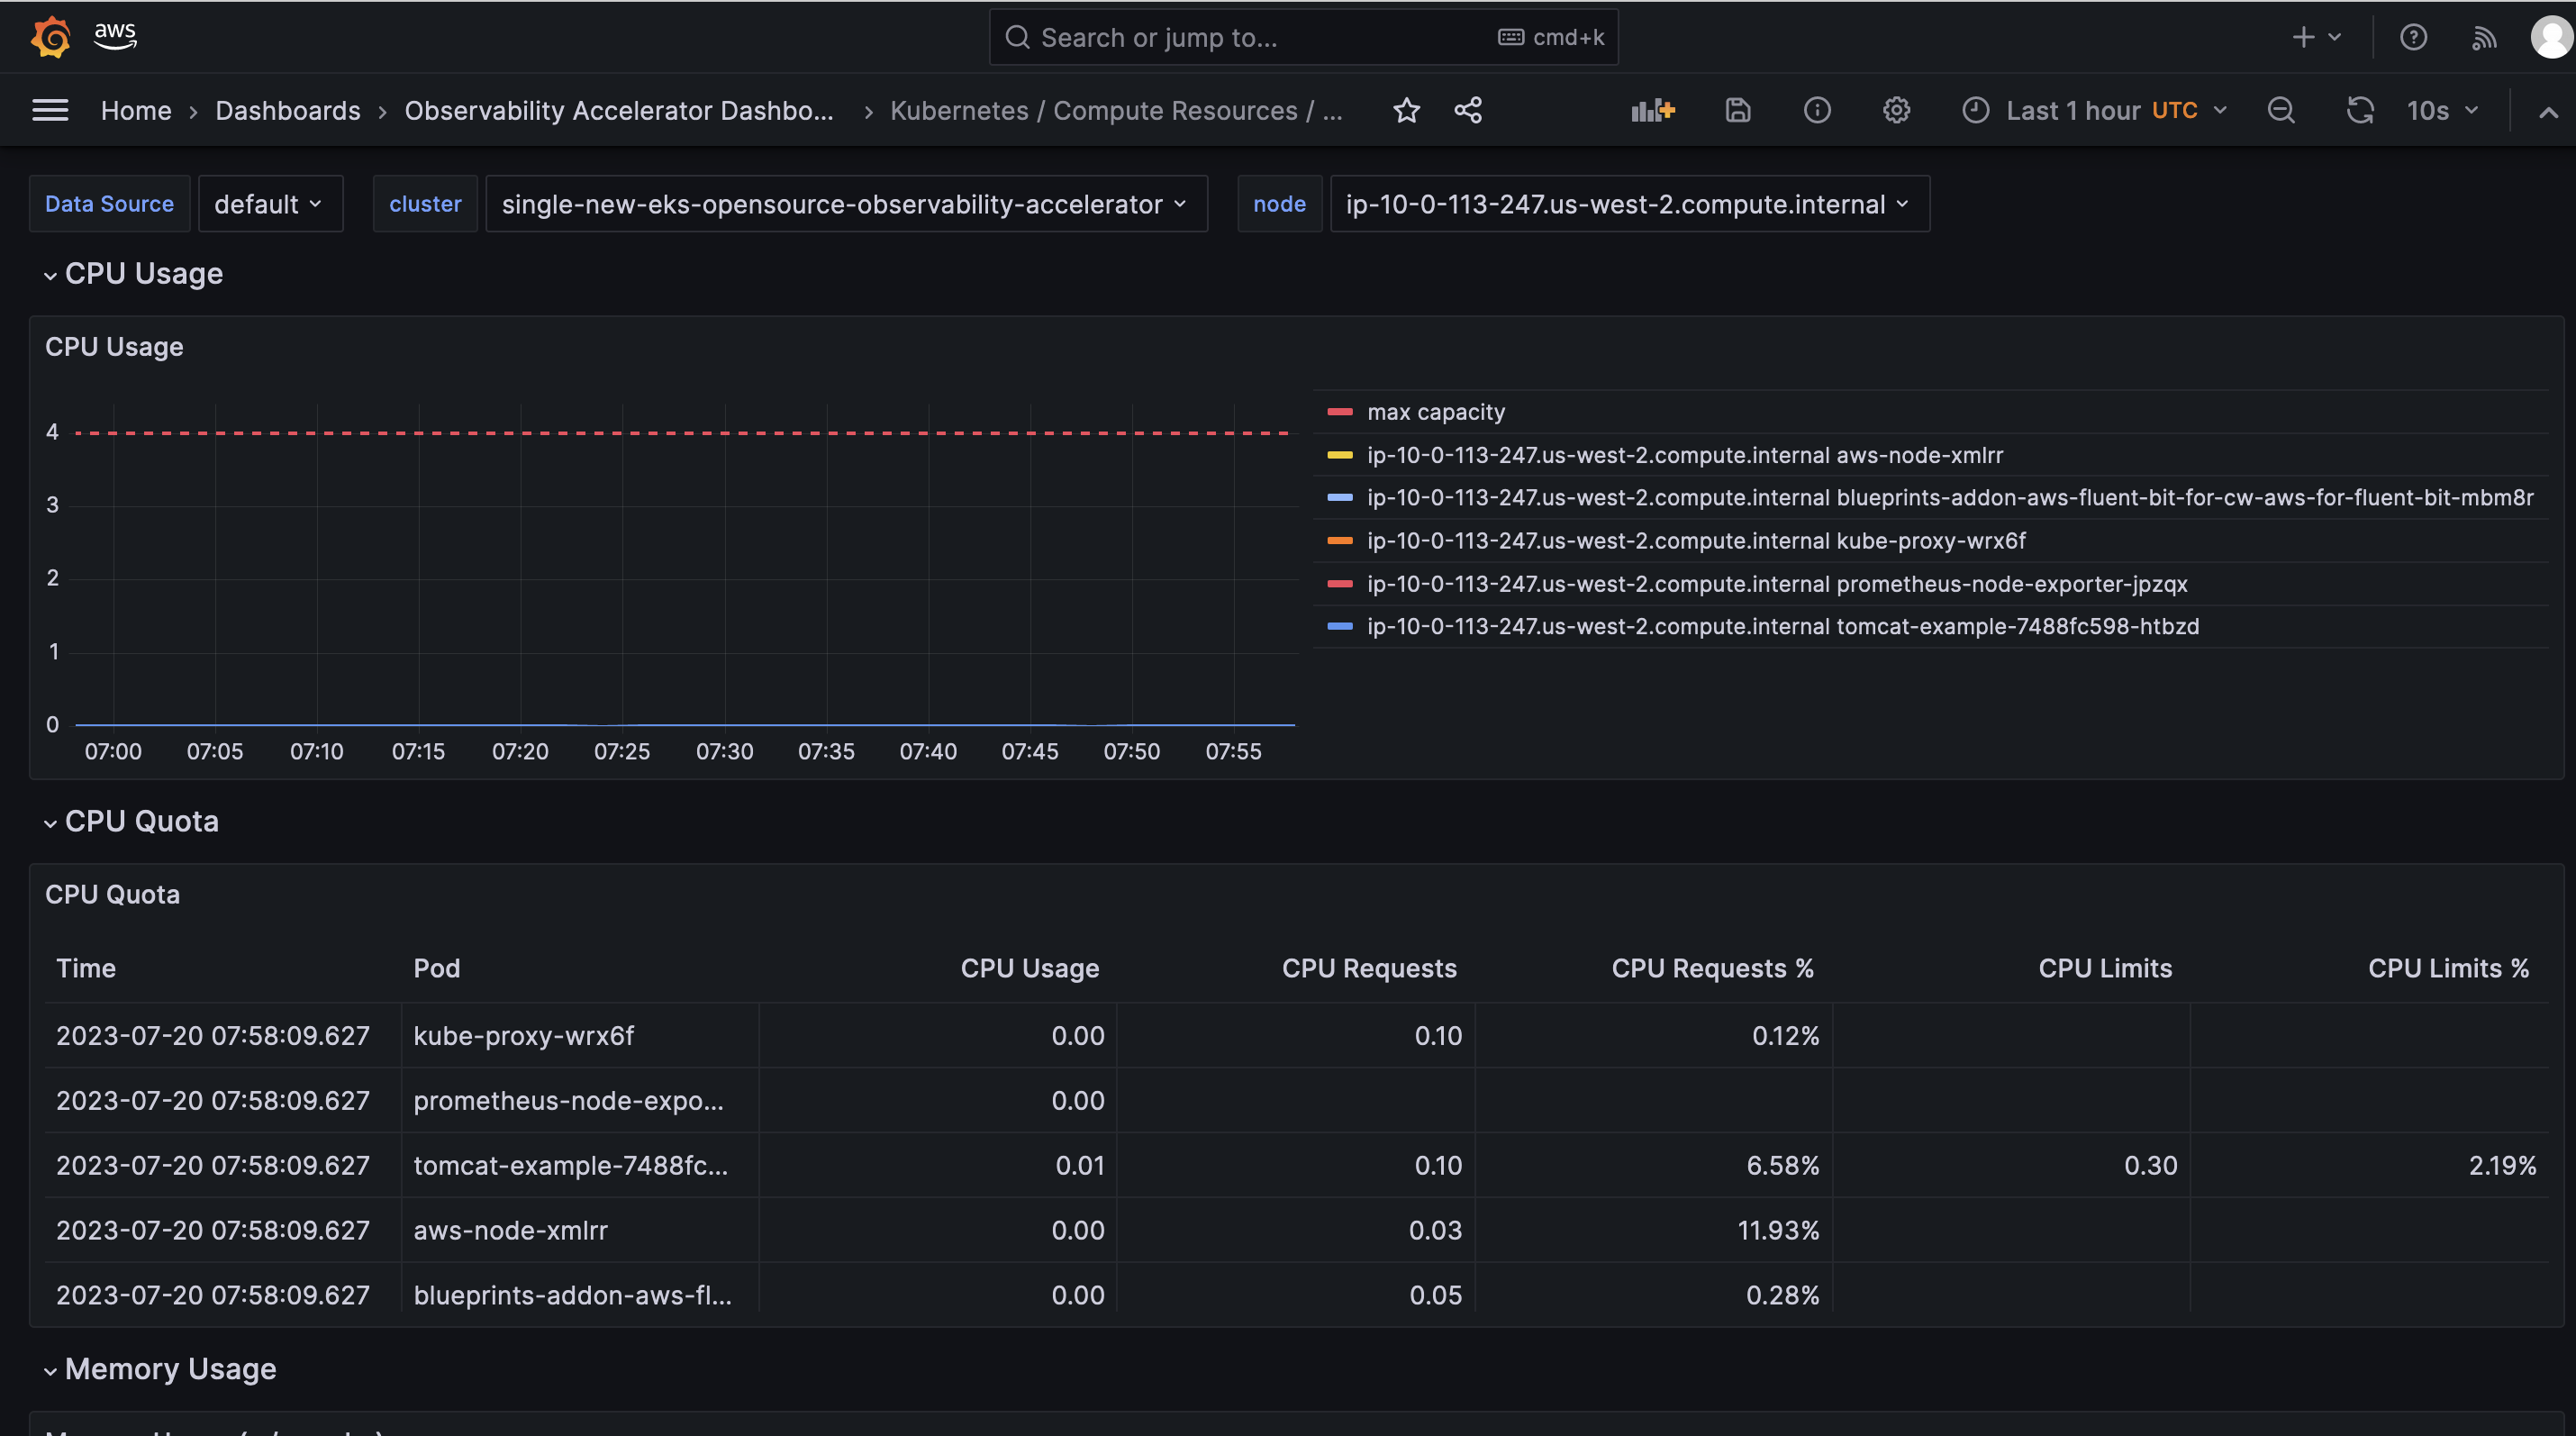
Open the Node (Pods) dashboard and you should be able to view its visualization as shown below :
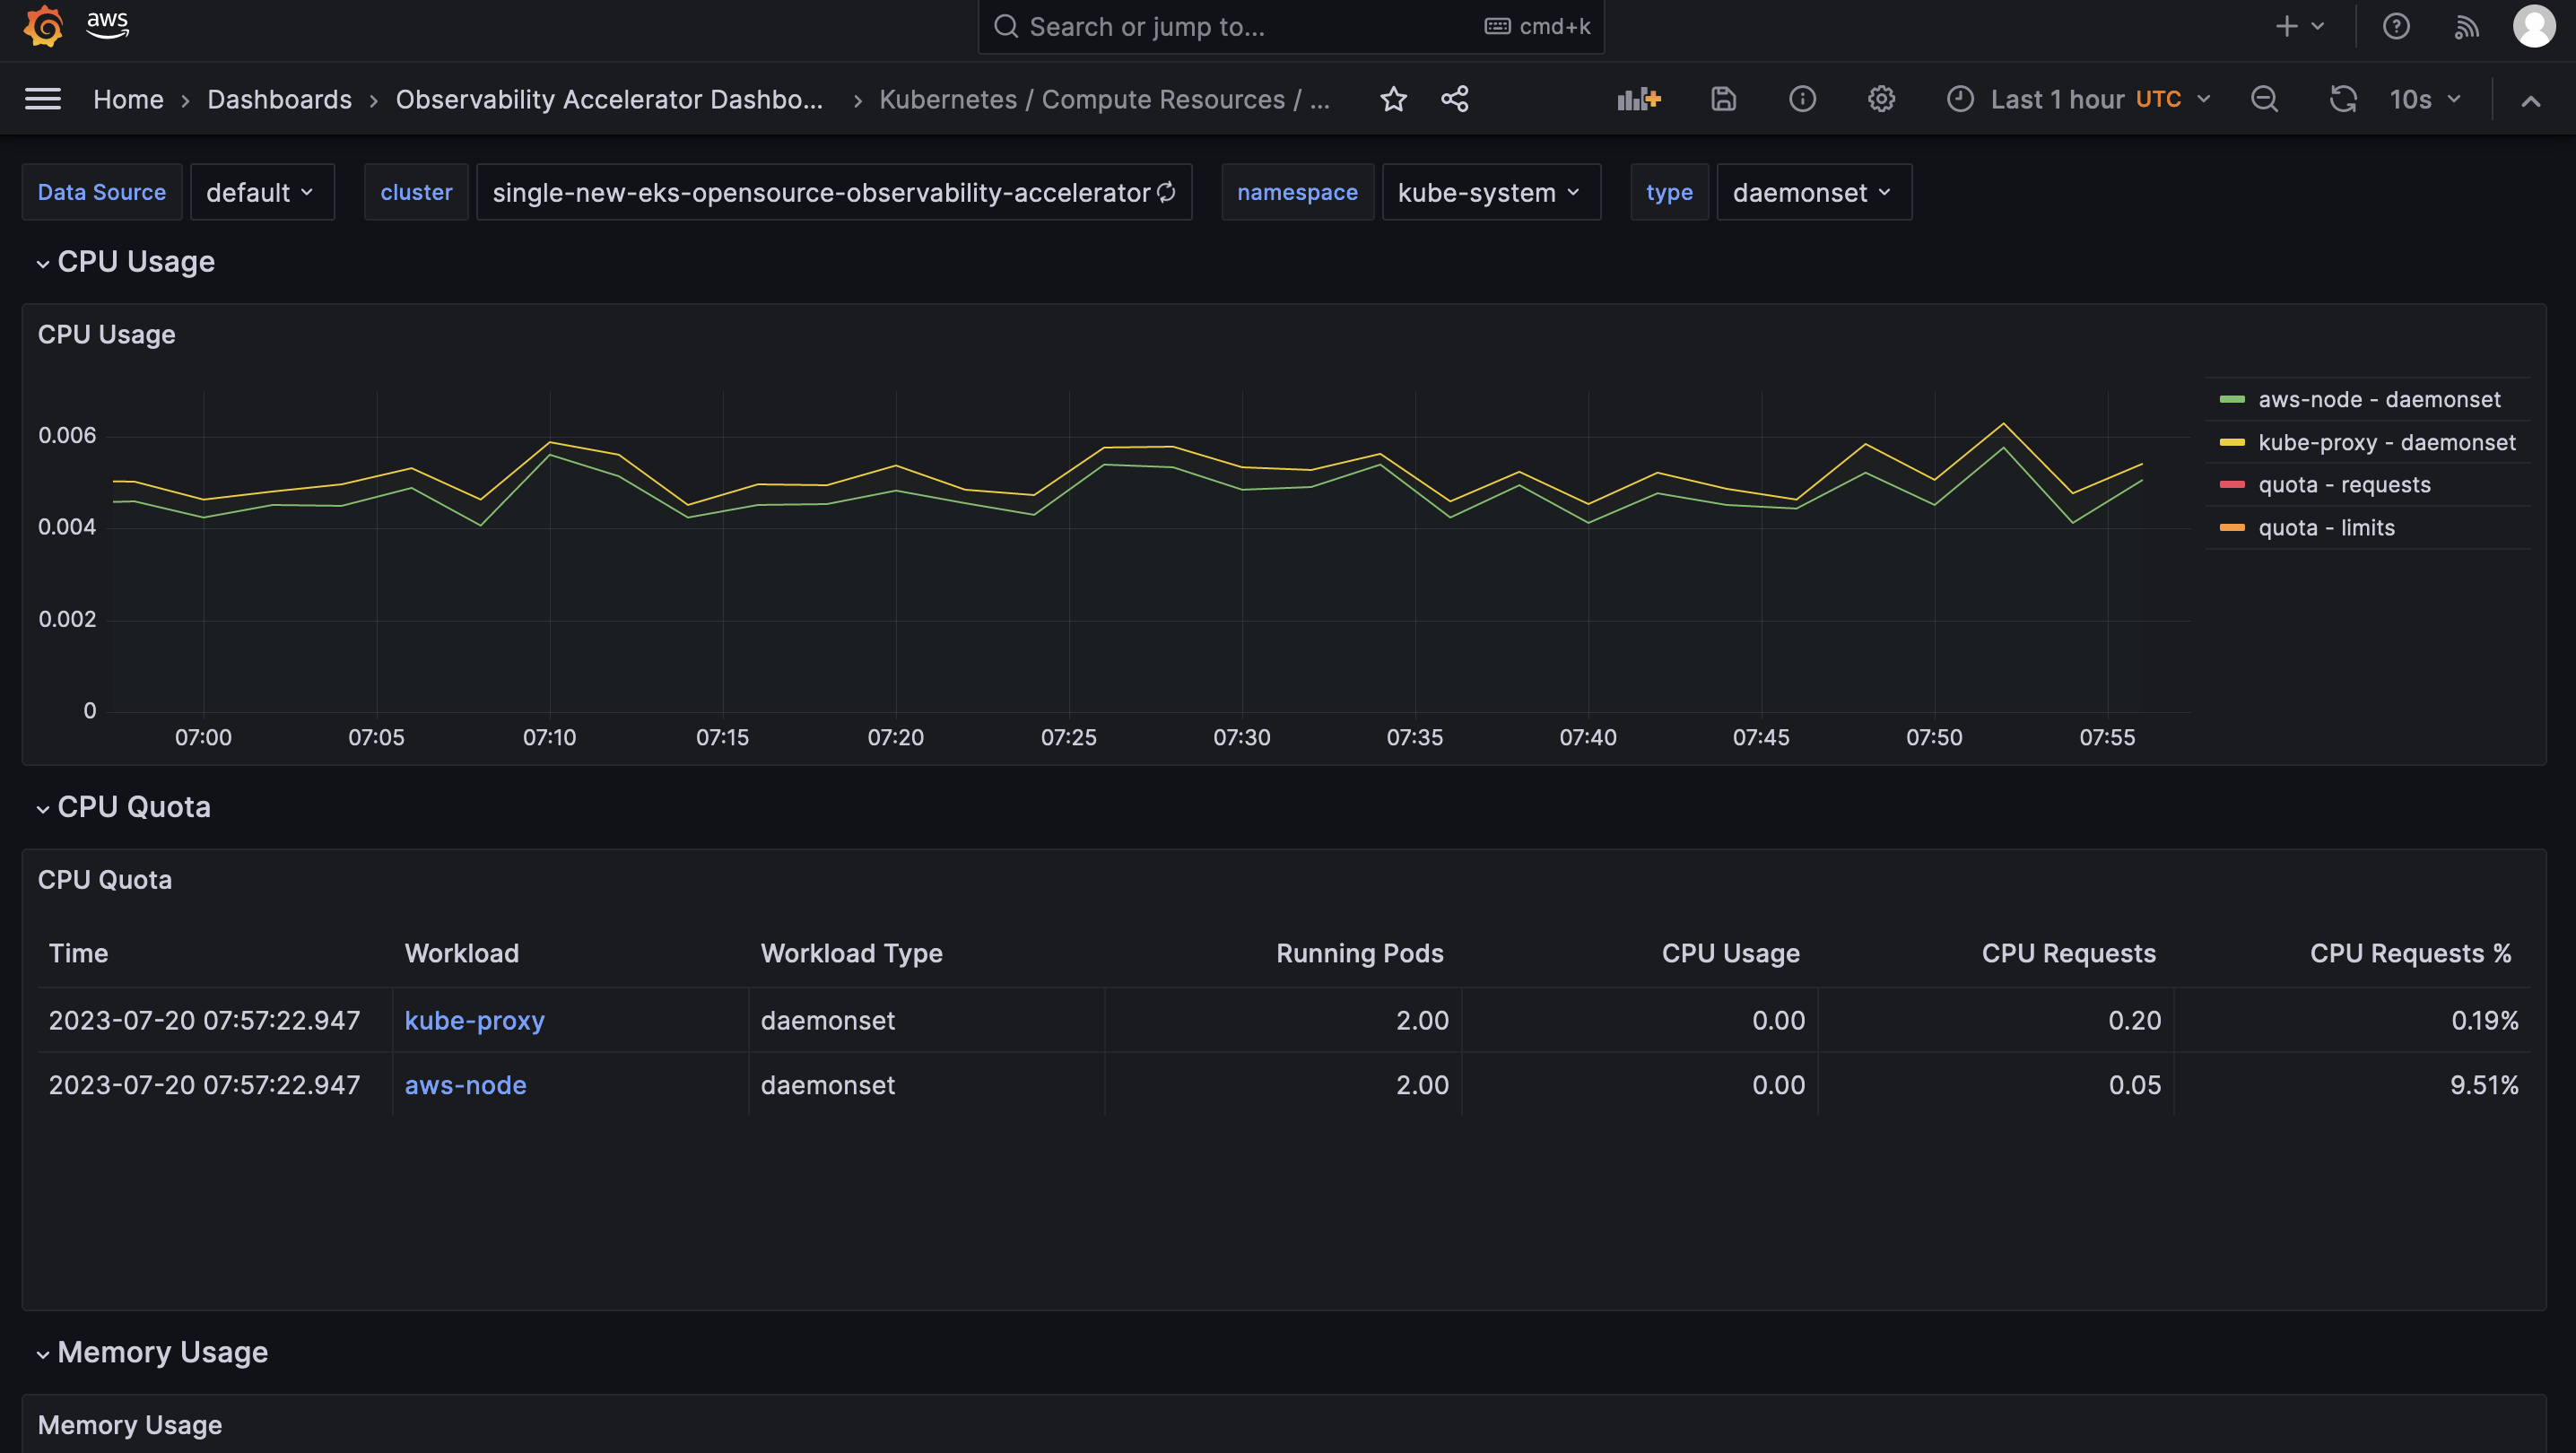
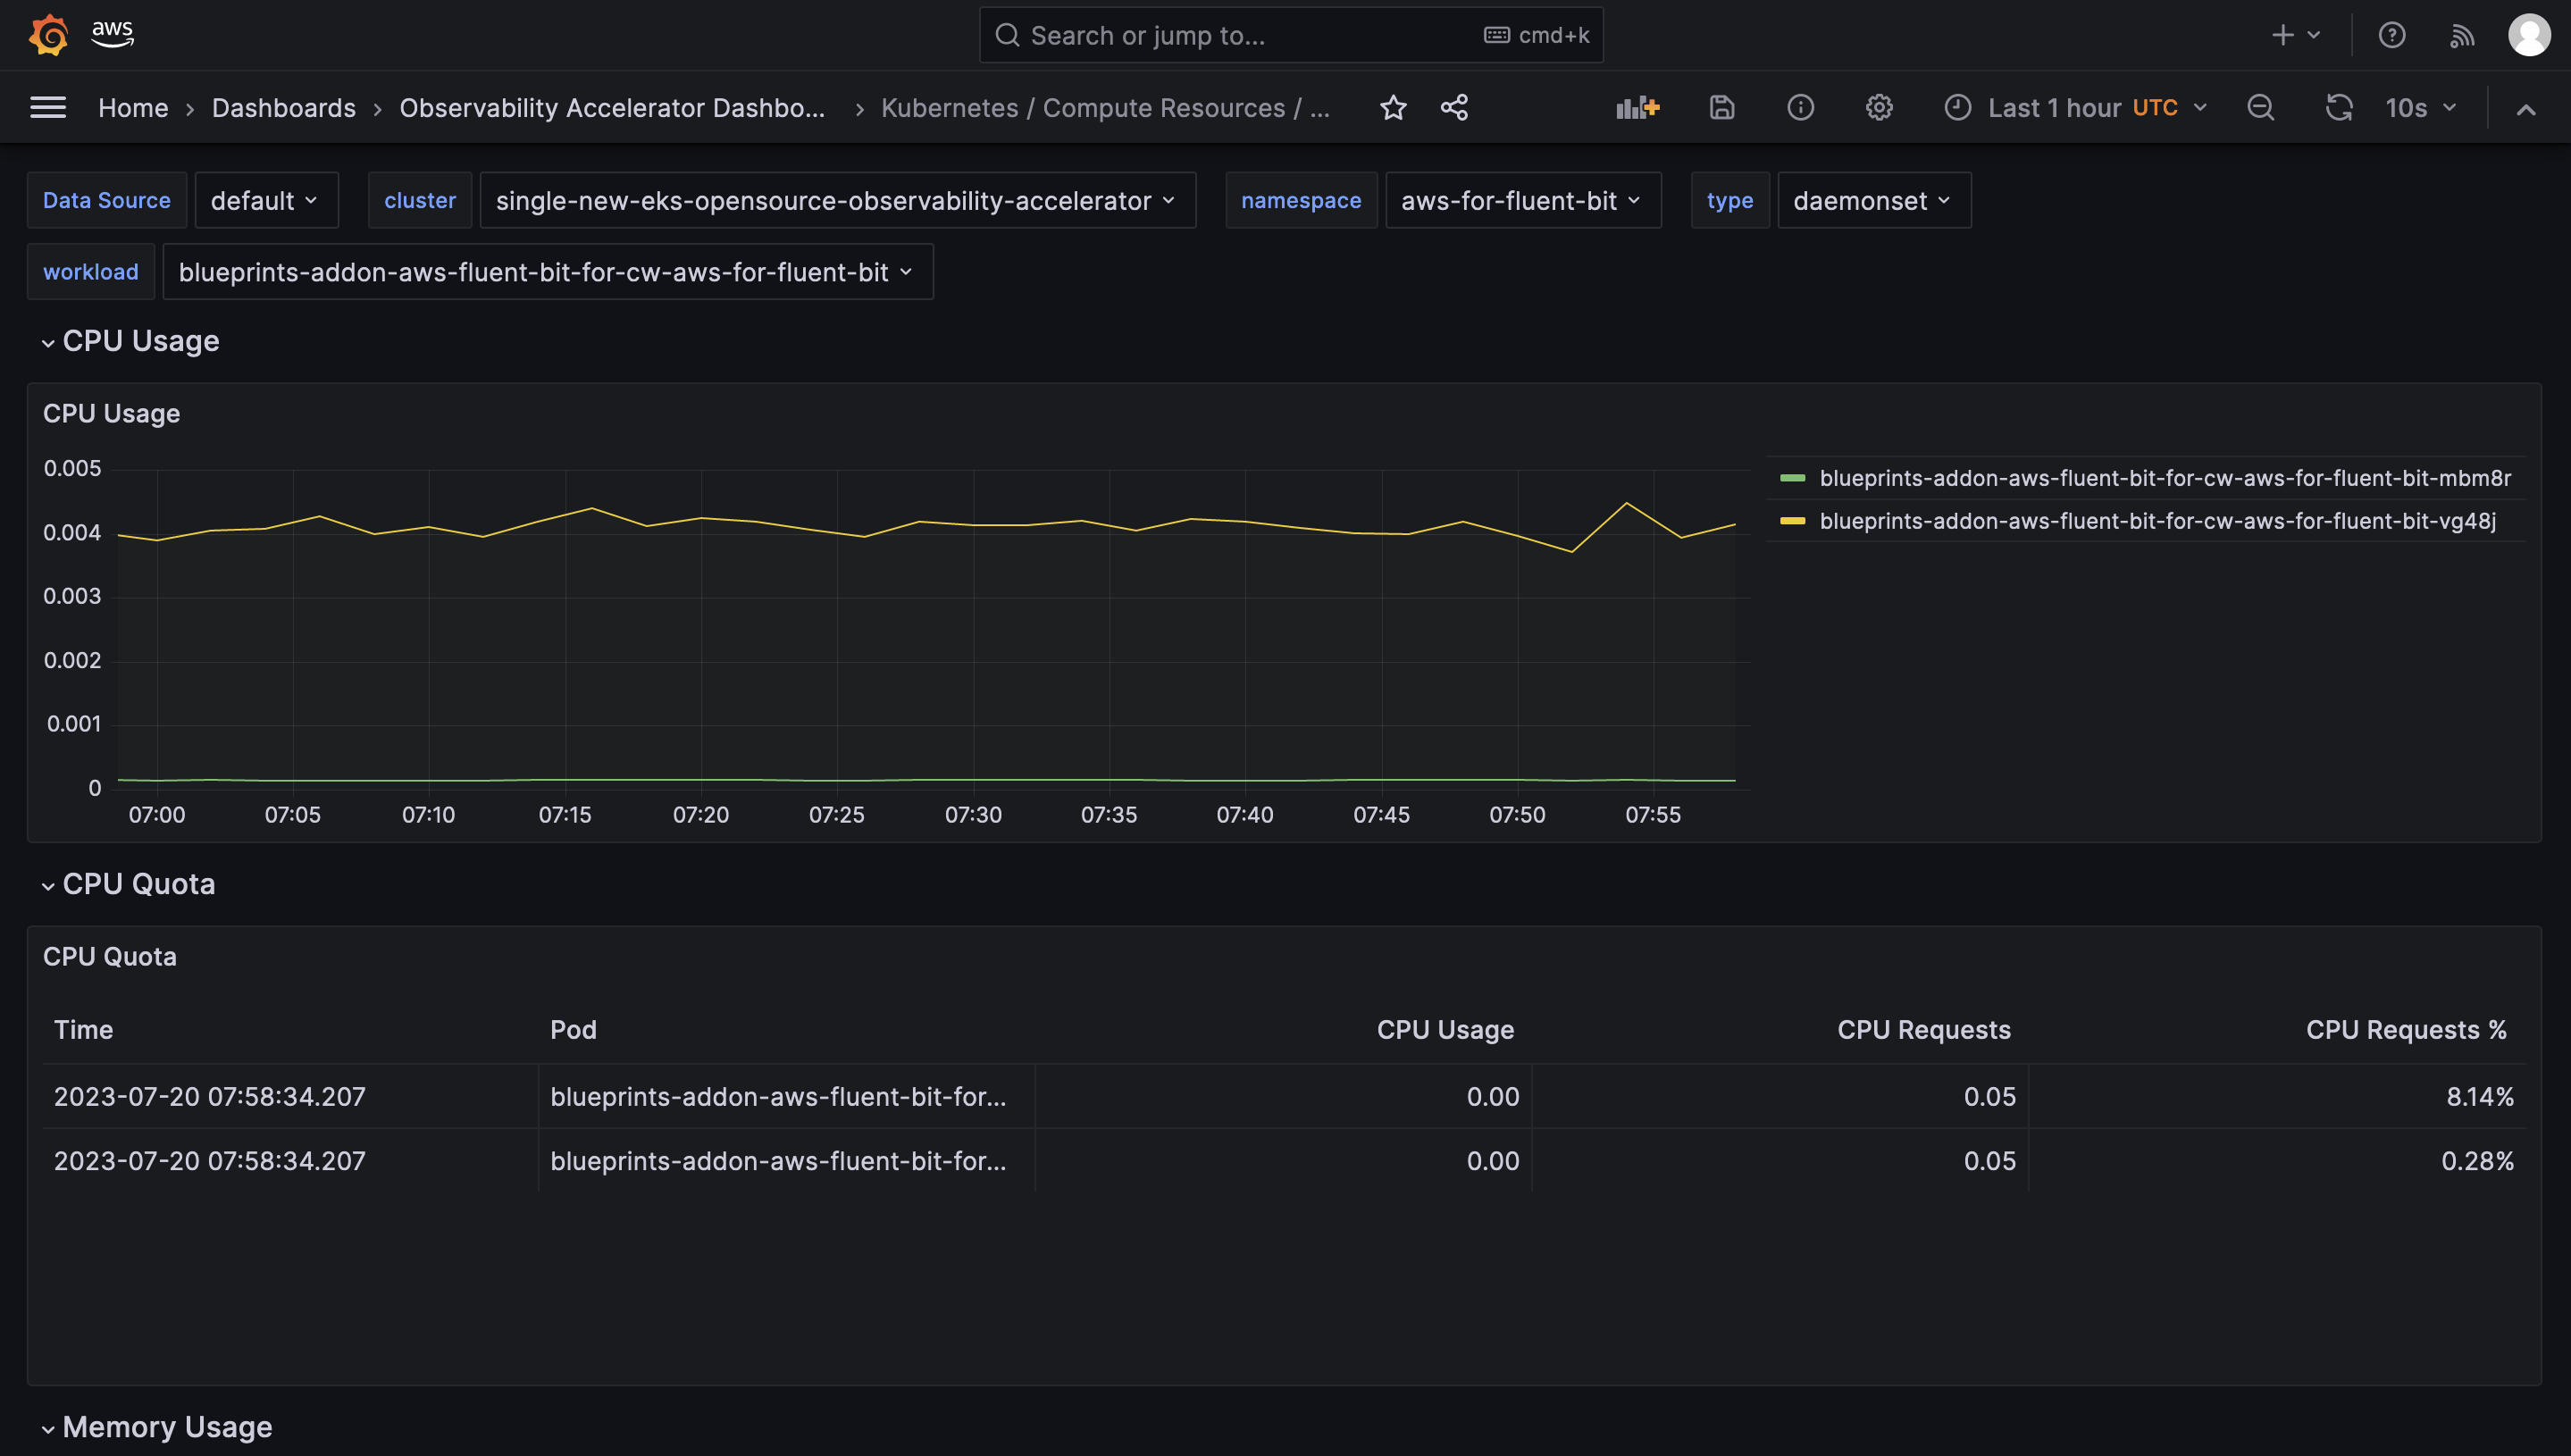
Open the Workload dashboard and you should be able to view its visualization as shown below :
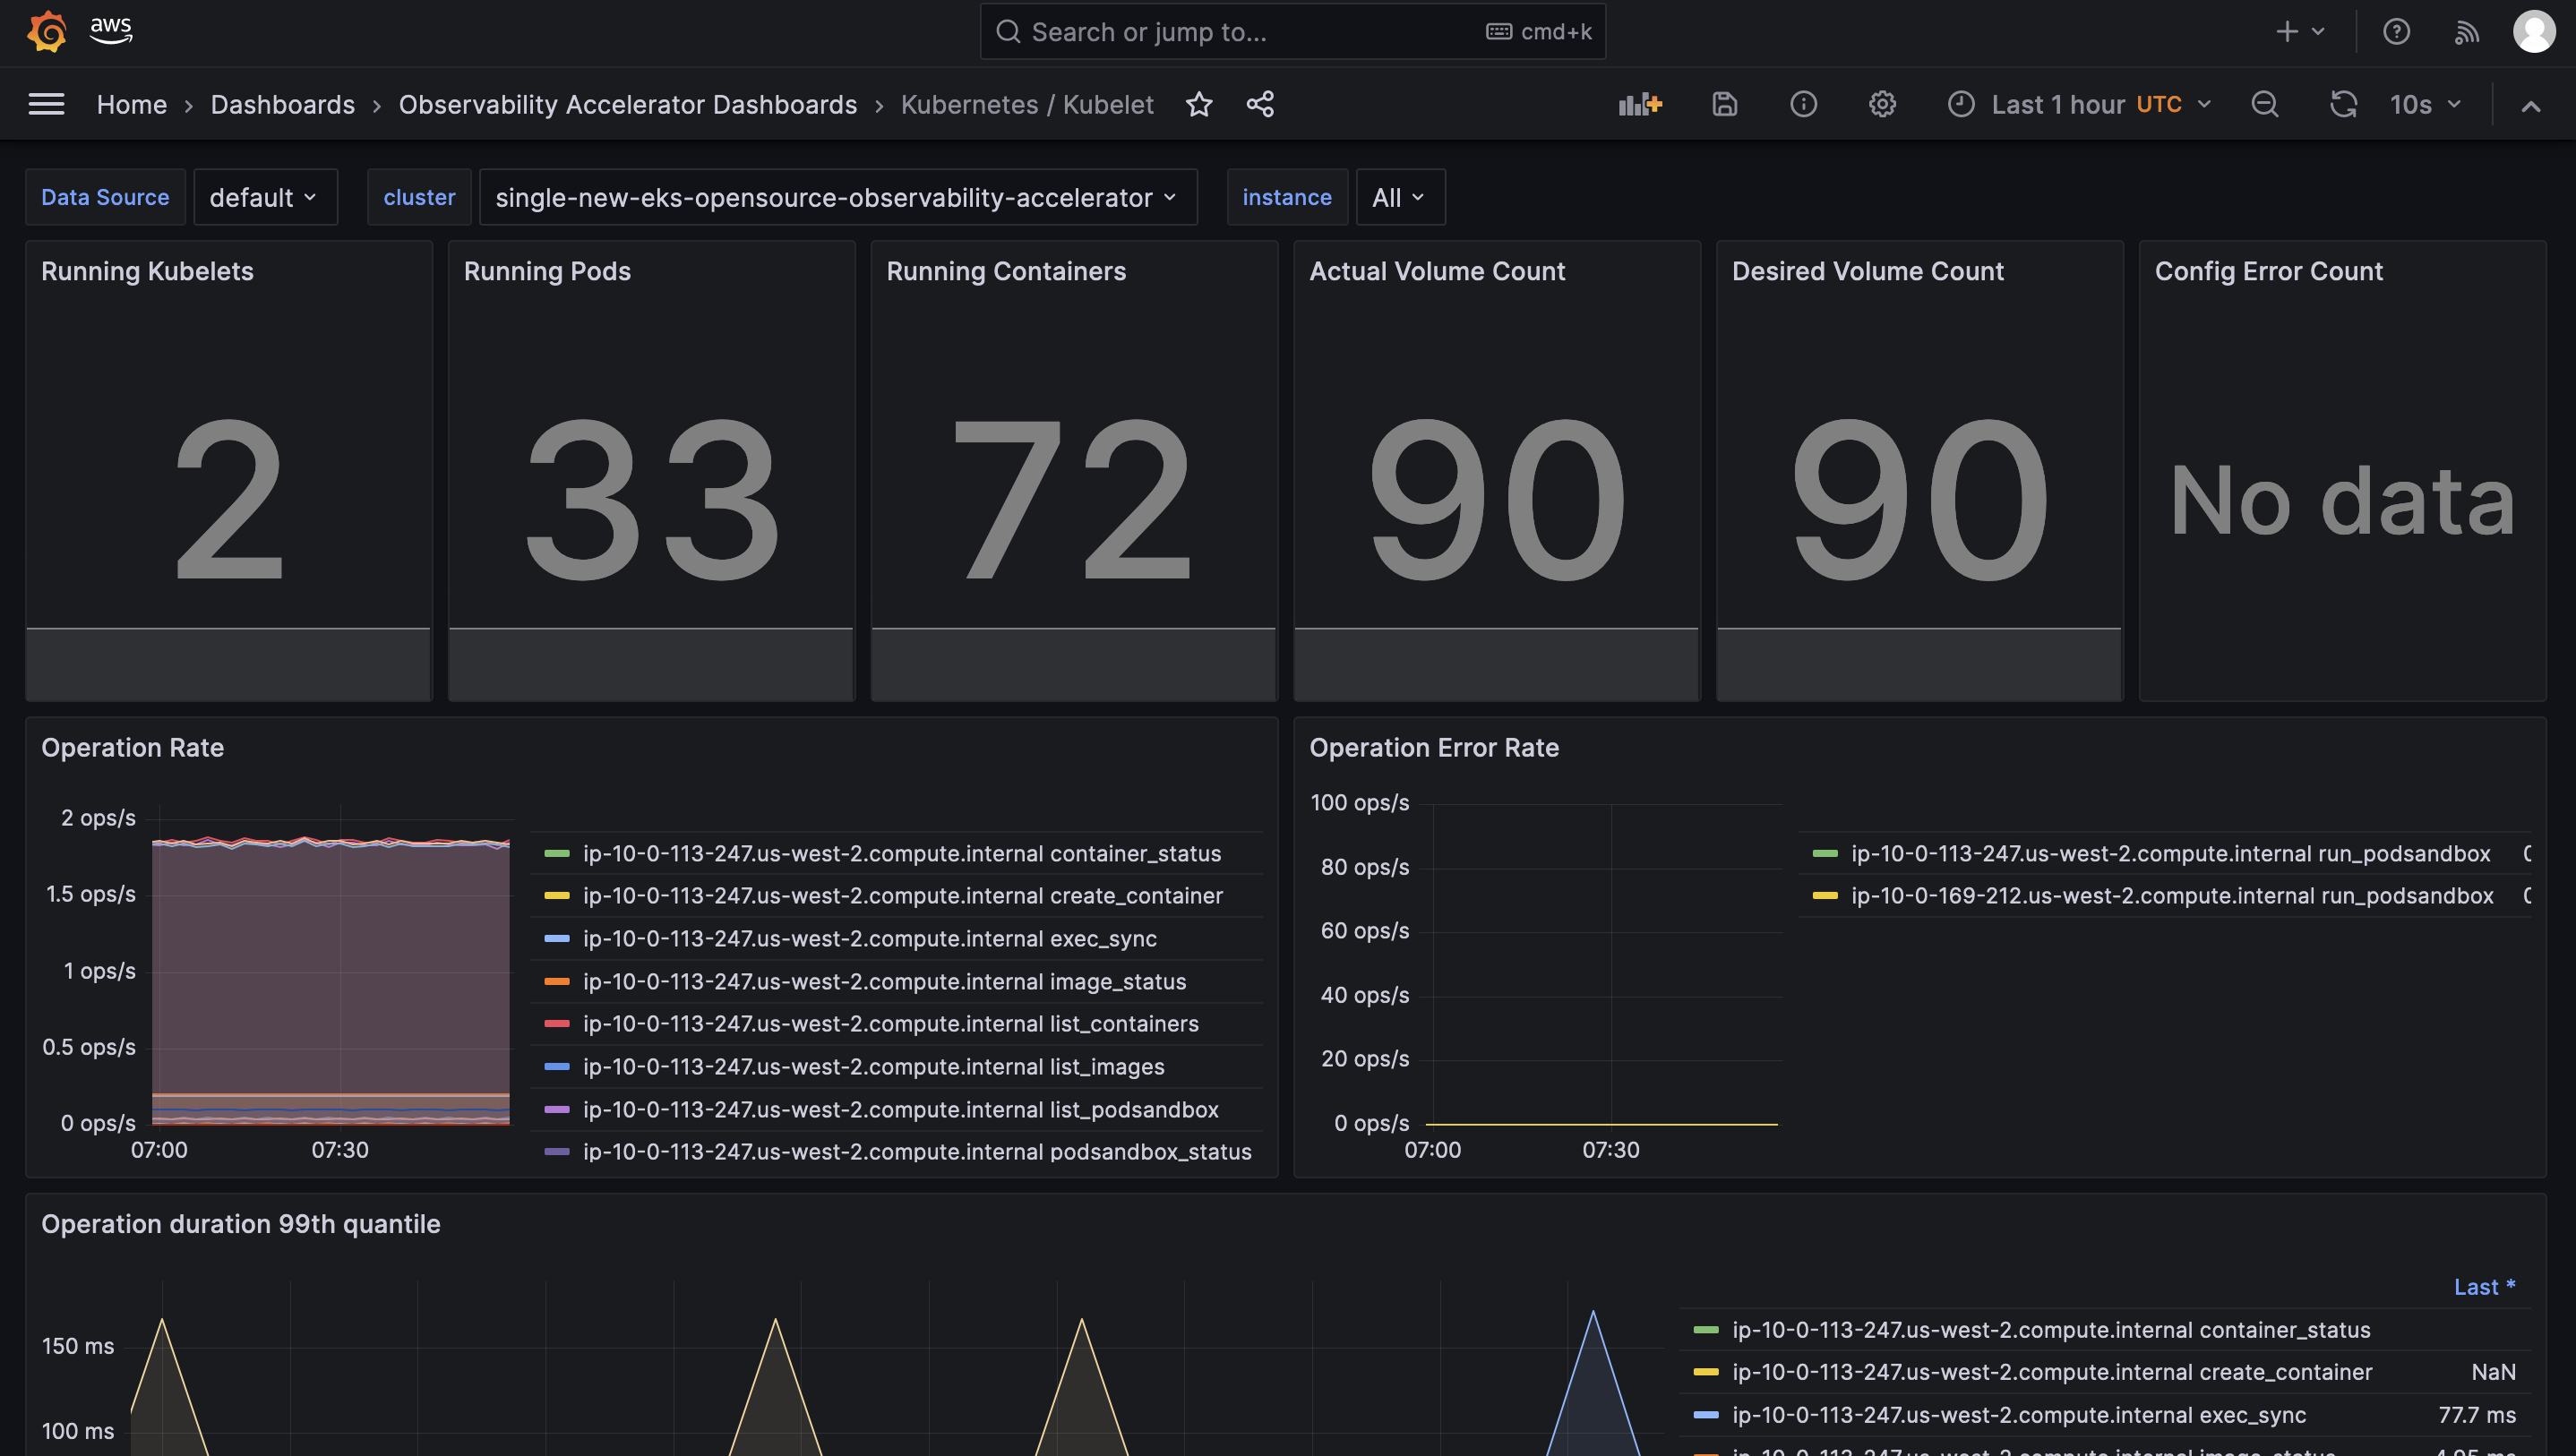
Open the Kubelet dashboard and you should be able to view its visualization as shown below :
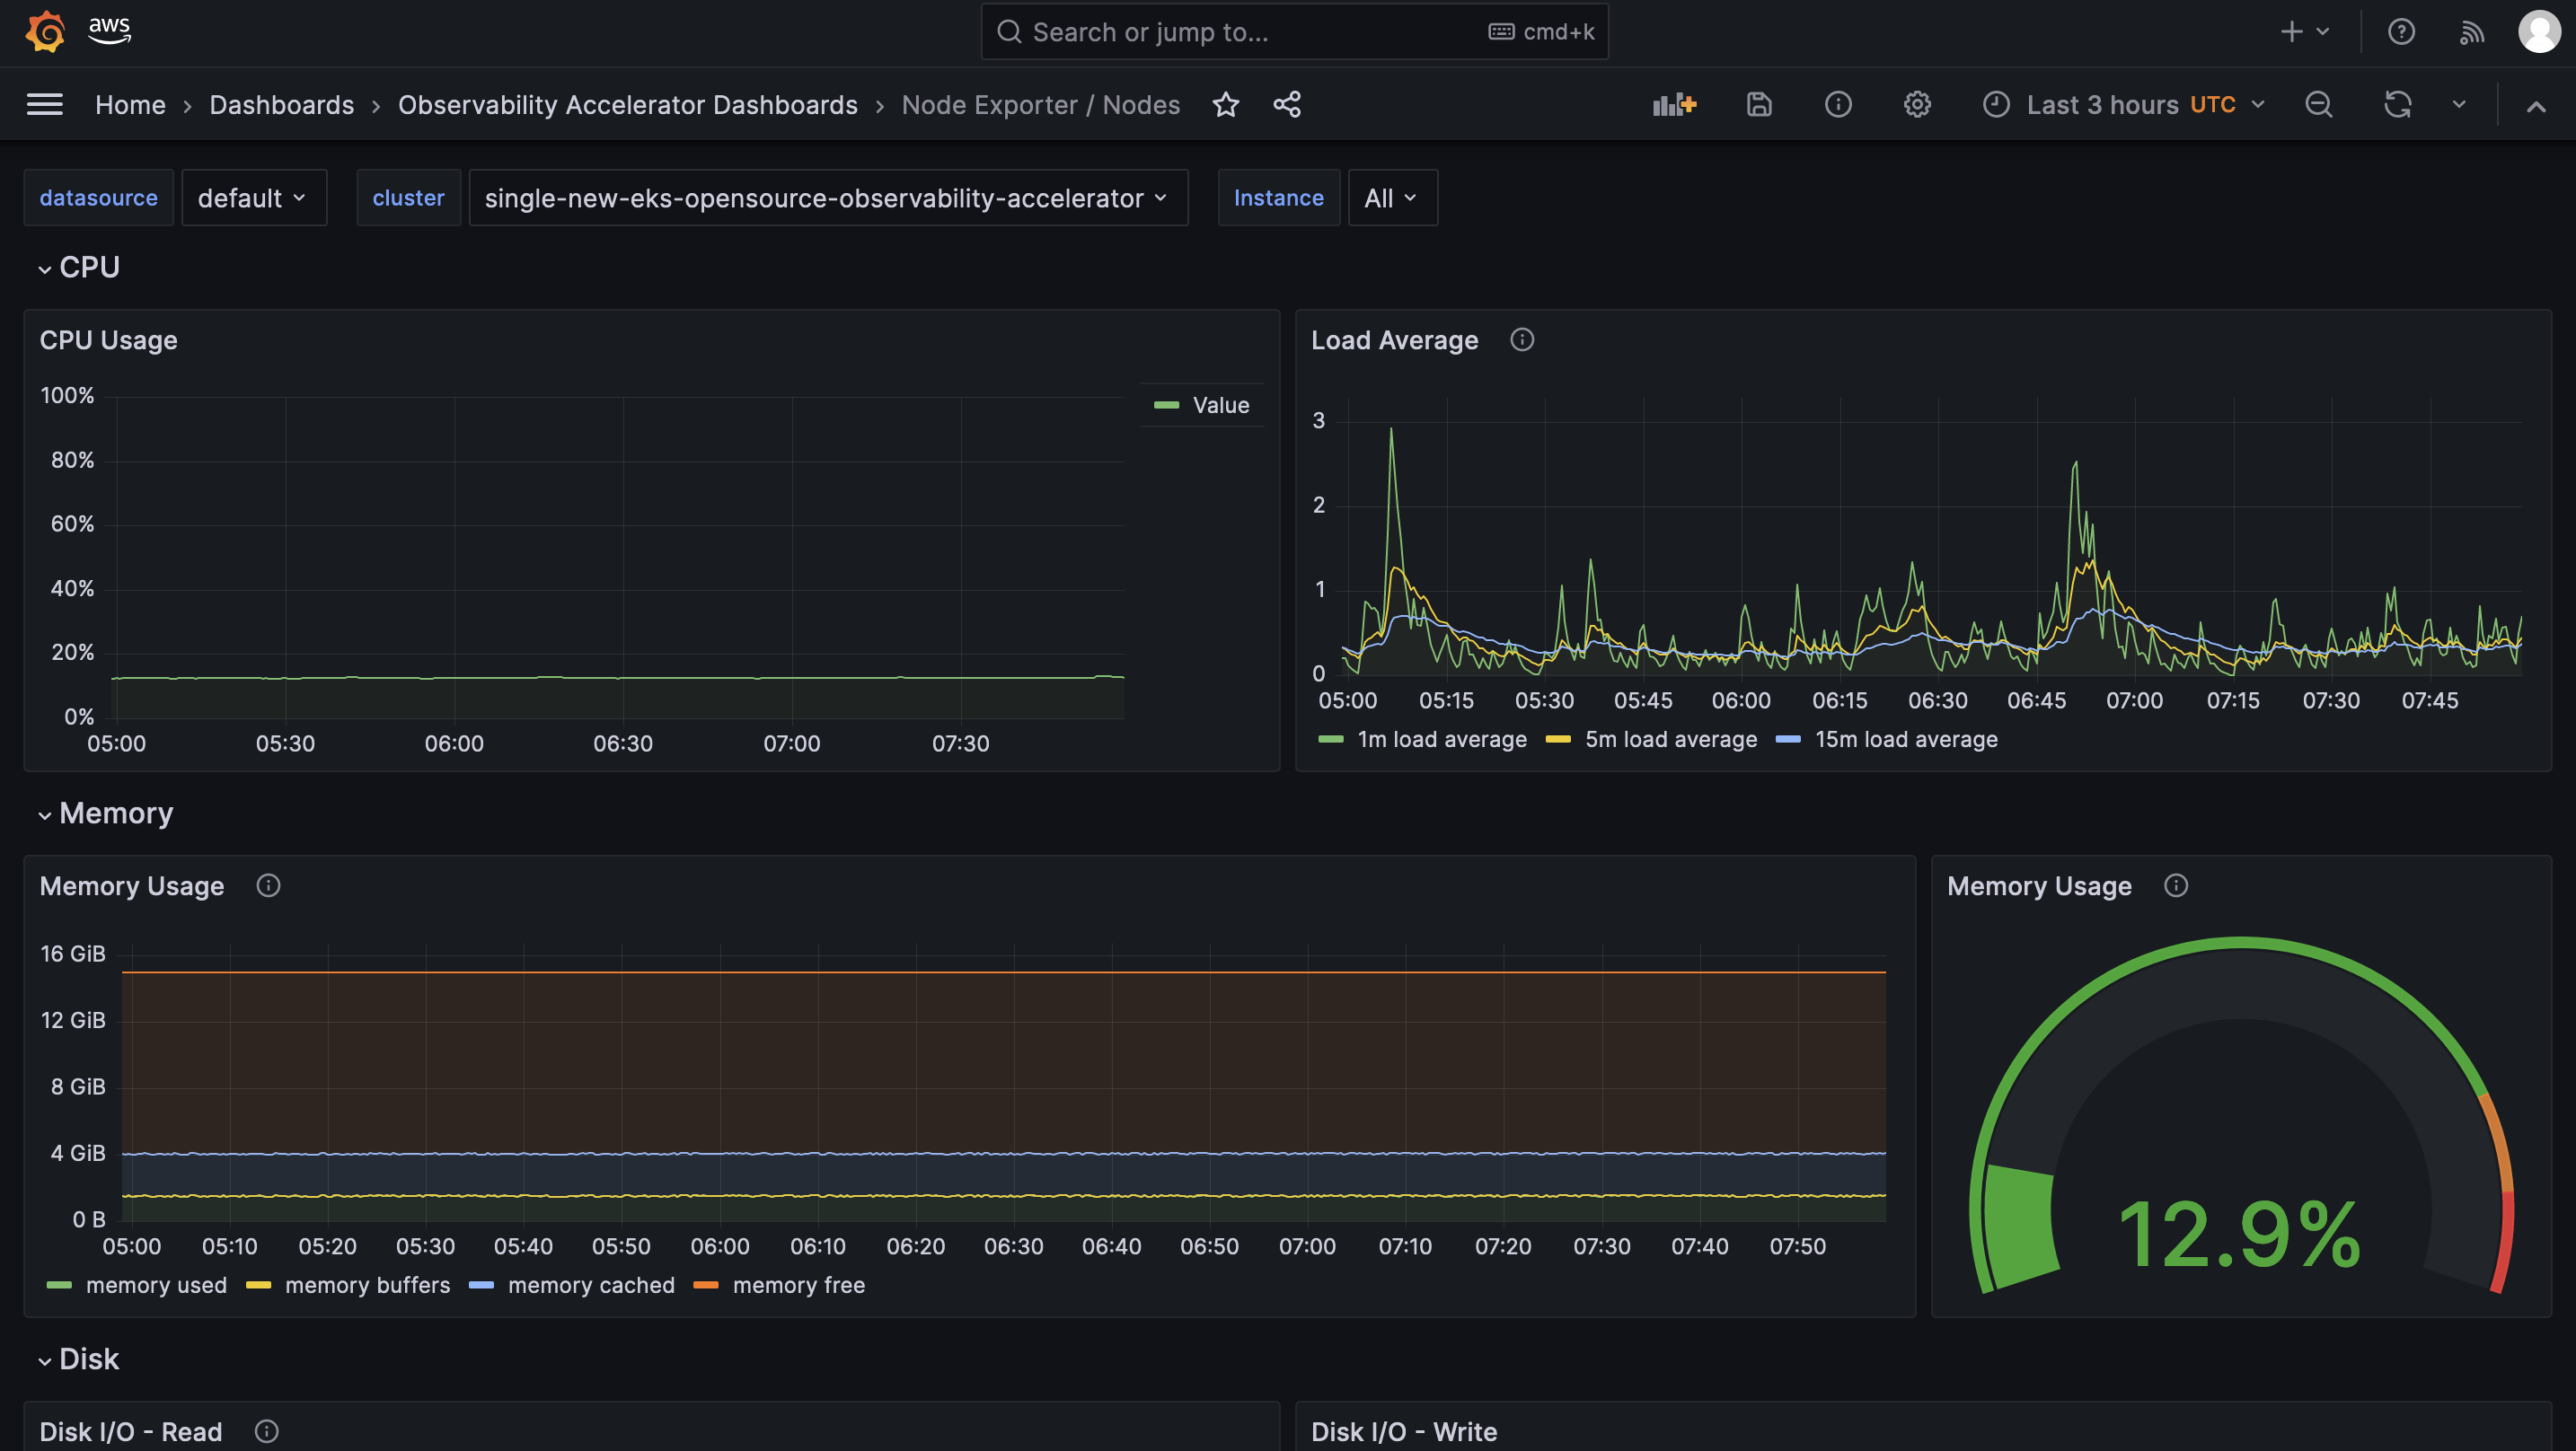
Open the Nodes dashboard and you should be able to view its visualization as shown below :
From the cluster to view all dashboards as Kubernetes objects, run:
kubectl get grafanadashboards -A
NAMESPACE          NAME                                   AGE
grafana-operator   cluster-grafanadashboard               138m
grafana-operator   java-grafanadashboard                  143m
grafana-operator   kubelet-grafanadashboard               13h
grafana-operator   namespace-workloads-grafanadashboard   13h
grafana-operator   nginx-grafanadashboard                 134m
grafana-operator   node-exporter-grafanadashboard         13h
grafana-operator   nodes-grafanadashboard                 13h
grafana-operator   workloads-grafanadashboard             13h
You can inspect more details per dashboard using this command
kubectl describe grafanadashboards cluster-grafanadashboard -n grafana-operator
Grafana Operator and Flux always work together to synchronize your dashboards with Git. If you delete your dashboards by accident, they will be re-provisioned automatically.
Viewing Logs
Refer to the "Using CloudWatch Logs as a data source in Grafana" section in Logging.
Teardown
You can teardown the whole CDK stack with the following command:
make pattern single-new-eks-graviton-opensource-observability destroy
Troubleshooting
1. Grafana dashboards missing or Grafana API key expired
In case you don't see the grafana dashboards in your Amazon Managed Grafana console, check on the logs on your grafana operator pod using the below command :
kubectl get pods -n grafana-operator
Output:
NAME                                READY   STATUS    RESTARTS   AGE
grafana-operator-866d4446bb-nqq5c   1/1     Running   0          3h17m
kubectl logs grafana-operator-866d4446bb-nqq5c -n grafana-operator
Output:
1.6857285045556655e+09  ERROR   error reconciling datasource    {"controller": "grafanadatasource", "controllerGroup": "grafana.integreatly.org", "controllerKind": "GrafanaDatasource", "GrafanaDatasource": {"name":"grafanadatasource-sample-amp","namespace":"grafana-operator"}, "namespace": "grafana-operator", "name": "grafanadatasource-sample-amp", "reconcileID": "72cfd60c-a255-44a1-bfbd-88b0cbc4f90c", "datasource": "grafanadatasource-sample-amp", "grafana": "external-grafana", "error": "status: 401, body: {\"message\":\"Expired API key\"}\n"}
github.com/grafana-operator/grafana-operator/controllers.(*GrafanaDatasourceReconciler).Reconcile
If you observe, the the above grafana-api-key error in the logs, your grafana API key is expired. Please use the operational procedure to update your grafana-api-key :
- First, lets create a new Grafana API key.
# IMPORTANT NOTE: skip this command if you already have a service token
GRAFANA_SA_ID=$(aws grafana create-workspace-service-account \
  --workspace-id $COA_AMG_WORKSPACE_ID \
  --grafana-role ADMIN \
  --name cdk-accelerator-eks \
  --query 'id' \
  --output text)

# creates a new token
export GO_AMG_API_KEY=$(aws grafana create-workspace-service-account-token \
  --workspace-id $COA_AMG_WORKSPACE_ID \
  -name "grafana-operator-key" \
  --seconds-to-live 432000 \
  --service-account-id $GRAFANA_SA_ID \
  --query 'serviceAccountToken.key' \
  --output text)
export GO_AMG_API_KEY=$(aws grafana create-workspace-api-key \
  --key-name "grafana-operator-key" \
  --key-role "ADMIN" \
  --seconds-to-live 432000 \
  --workspace-id $COA_AMG_WORKSPACE_ID \
  --query key \
  --output text)
- Finally, update the Grafana API key secret in AWS Secrets Manager using the above new Grafana API key:
export API_KEY_SECRET_NAME="grafana-api-key"
aws secretsmanager update-secret \
    --secret-id $API_KEY_SECRET_NAME \
    --secret-string "${AMG_API_KEY}" \
    --region $AWS_REGION
- If the issue persists, you can force the synchronization by deleting the
externalsecretKubernetes object.
kubectl delete externalsecret/external-secrets-sm -n grafana-operator