Single Cluster Open Source Observability - API Server Monitoring
Objective
This pattern aims to add Observability on top of an existing EKS cluster and adds API server monitoring, with open source managed AWS services.
Prerequisites:
Ensure that you have installed the following tools on your machine:
You will also need:
- Either an existing EKS cluster, or you can setup a new one with Single New EKS Cluster Observability Accelerator
- An OpenID Connect (OIDC) provider, associated to the above EKS cluster (Note: Single EKS Cluster Pattern takes care of that for you)
Deploying
!!! note If control plane logging is not enabled in the existing cluster, edit
lib/existing-eks-opensource-observability-pattern/index.ts to include .enableControlPlaneLogging() as shown below:
    ObservabilityBuilder.builder()
        // some properties
        .enableControlPlaneLogging()
        // other properties
        .build(scope, stackId);
- Edit
~/.cdk.jsonby setting the name of your existing cluster:
    "context": {
        ...
        "existing.cluster.name": "...",
        ...
    }
- Edit
~/.cdk.jsonby setting the kubectl role name; if you used Single New EKS Cluster Observability Accelerator to setup your cluster, the kubectl role name would be provided by the output of the deployment, on your command-line interface (CLI):
    "context": {
        ...
        "existing.kubectl.rolename":"...",
        ...
    }
- Amazon Managed Grafana workspace: To visualize metrics collected, you need an Amazon Managed Grafana workspace. If you have an existing workspace, create an environment variable as described below. To create a new workspace, visit our supporting example for Grafana
Note
For the URL https://g-xyz.grafana-workspace.us-east-1.amazonaws.com, the workspace ID would be g-xyz
export AWS_REGION=<YOUR AWS REGION>
export COA_AMG_WORKSPACE_ID=g-xxx
export COA_AMG_ENDPOINT_URL=https://g-xyz.grafana-workspace.us-east-1.amazonaws.com
Warning
Setting up environment variables COA_AMG_ENDPOINT_URL and AWS_REGION is mandatory for successful execution of this pattern.
- GRAFANA API KEY: Amazon Managed Grafana provides a control plane API for generating Grafana API keys or Service Account Tokens.
# IMPORTANT NOTE: skip this command if you already have a service token
GRAFANA_SA_ID=$(aws grafana create-workspace-service-account \
  --workspace-id $COA_AMG_WORKSPACE_ID \
  --grafana-role ADMIN \
  --name cdk-accelerator-eks \
  --query 'id' \
  --output text)

# creates a new token
export AMG_API_KEY=$(aws grafana create-workspace-service-account-token \
  --workspace-id $COA_AMG_WORKSPACE_ID \
  -name "grafana-operator-key" \
  --seconds-to-live 432000 \
  --service-account-id $GRAFANA_SA_ID \
  --query 'serviceAccountToken.key' \
  --output text)
export AMG_API_KEY=$(aws grafana create-workspace-api-key \
  --key-name "grafana-operator-key" \
  --key-role "ADMIN" \
  --seconds-to-live 432000 \
  --workspace-id $COA_AMG_WORKSPACE_ID \
  --query key \
  --output text)
- AWS SSM Parameter Store for GRAFANA API KEY: Update the Grafana API key secret in AWS SSM Parameter Store using the above new Grafana API key. This will be referenced by Grafana Operator deployment of our solution to access Amazon Managed Grafana from Amazon EKS Cluster
aws ssm put-parameter --name "/cdk-accelerator/grafana-api-key" \
    --type "SecureString" \
    --value $AMG_API_KEY \
    --region $AWS_REGION
-
Install project dependencies by running
npm installin the main folder of this cloned repository. -
The actual settings for dashboard urls are expected to be specified in the CDK context. Generically it is inside the cdk.json file of the current directory or in
~/.cdk.jsonin your home directory.
Example settings: Update the context in cdk.json file located in cdk-eks-blueprints-patterns directory
  "context": {
    "fluxRepository": {
      "name": "grafana-dashboards",
      "namespace": "grafana-operator",
      "repository": {
        "repoUrl": "https://github.com/aws-observability/aws-observability-accelerator",
        "name": "grafana-dashboards",
        "targetRevision": "main",
        "path": "./artifacts/grafana-operator-manifests/eks/infrastructure"
      },
      "values": {
        "GRAFANA_CLUSTER_DASH_URL" : "https://raw.githubusercontent.com/aws-observability/aws-observability-accelerator/main/artifacts/grafana-dashboards/eks/infrastructure/cluster.json",
        "GRAFANA_KUBELET_DASH_URL" : "https://raw.githubusercontent.com/aws-observability/aws-observability-accelerator/main/artifacts/grafana-dashboards/eks/infrastructure/kubelet.json",
        "GRAFANA_NSWRKLDS_DASH_URL" : "https://raw.githubusercontent.com/aws-observability/aws-observability-accelerator/main/artifacts/grafana-dashboards/eks/infrastructure/namespace-workloads.json",
        "GRAFANA_NODEEXP_DASH_URL" : "https://raw.githubusercontent.com/aws-observability/aws-observability-accelerator/main/artifacts/grafana-dashboards/eks/infrastructure/nodeexporter-nodes.json",
        "GRAFANA_NODES_DASH_URL" : "https://raw.githubusercontent.com/aws-observability/aws-observability-accelerator/main/artifacts/grafana-dashboards/eks/infrastructure/nodes.json",
        "GRAFANA_WORKLOADS_DASH_URL" : "https://raw.githubusercontent.com/aws-observability/aws-observability-accelerator/main/artifacts/grafana-dashboards/eks/infrastructure/workloads.json",
        "GRAFANA_APISERVER_BASIC_DASH_URL" : "https://raw.githubusercontent.com/aws-observability/aws-observability-accelerator/main/artifacts/grafana-dashboards/eks/apiserver/apiserver-basic.json",
        "GRAFANA_APISERVER_ADVANCED_DASH_URL" : "https://raw.githubusercontent.com/aws-observability/aws-observability-accelerator/main/artifacts/grafana-dashboards/eks/apiserver/apiserver-advanced.json",
        "GRAFANA_APISERVER_TROUBLESHOOTING_DASH_URL" : "https://raw.githubusercontent.com/aws-observability/aws-observability-accelerator/main/artifacts/grafana-dashboards/eks/apiserver/apiserver-troubleshooting.json",
        "GRAFANA_KSH_DASH_URL" : "https://raw.githubusercontent.com/aws-observability/aws-observability-accelerator/main/artifacts/grafana-dashboards/eks/infrastructure/ksh.json",
        "GRAFANA_KCM_DASH_URL" : "https://raw.githubusercontent.com/aws-observability/aws-observability-accelerator/main/artifacts/grafana-dashboards/eks/infrastructure/kcm.json"
      },
      "kustomizations": [
        {
          "kustomizationPath": "./artifacts/grafana-operator-manifests/eks/infrastructure"
        },
        {
          "kustomizationPath": "./artifacts/grafana-operator-manifests/eks/apiserver"
        }
      ]
    },
    "apiserver.pattern.enabled": true
  }
- Once all pre-requisites are set you are ready to deploy the pipeline. Run the following command from the root of this repository to deploy the pipeline stack:
make build
make pattern existing-eks-opensource-observability deploy
Visualization
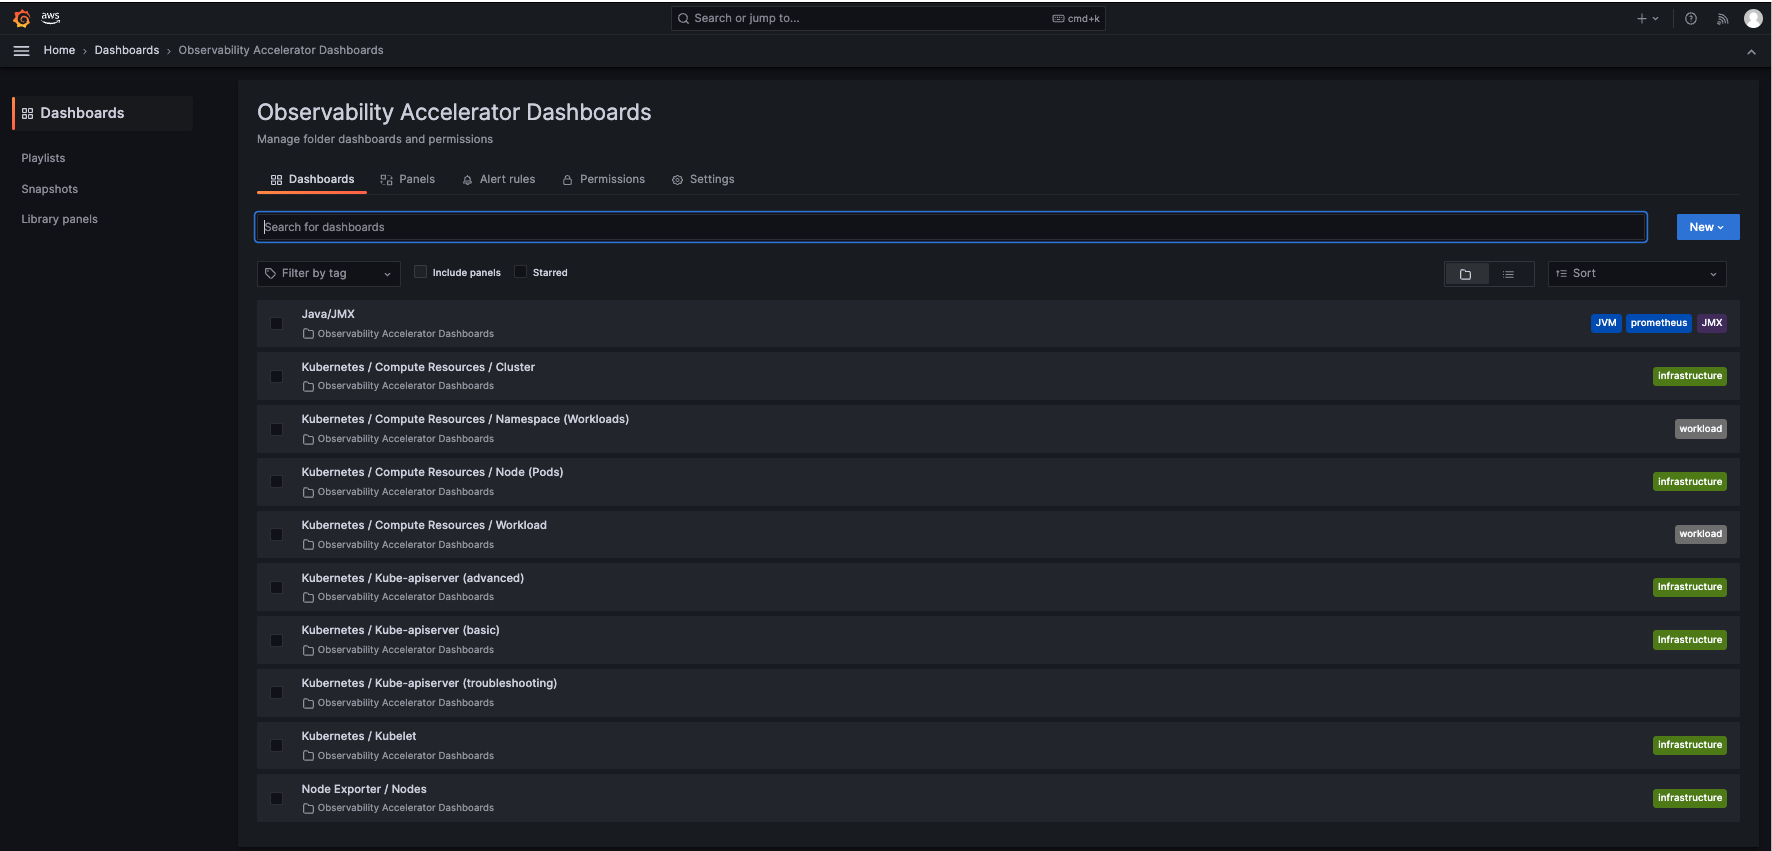
Login to your Grafana workspace and navigate to the Dashboards panel. You should see three new dashboard named Kubernetes/Kube-apiserver (basic), Kubernetes/Kube-apiserver (advanced), Kubernetes/Kube-apiserver (troubleshooting), under Observability Accelerator Dashboards:
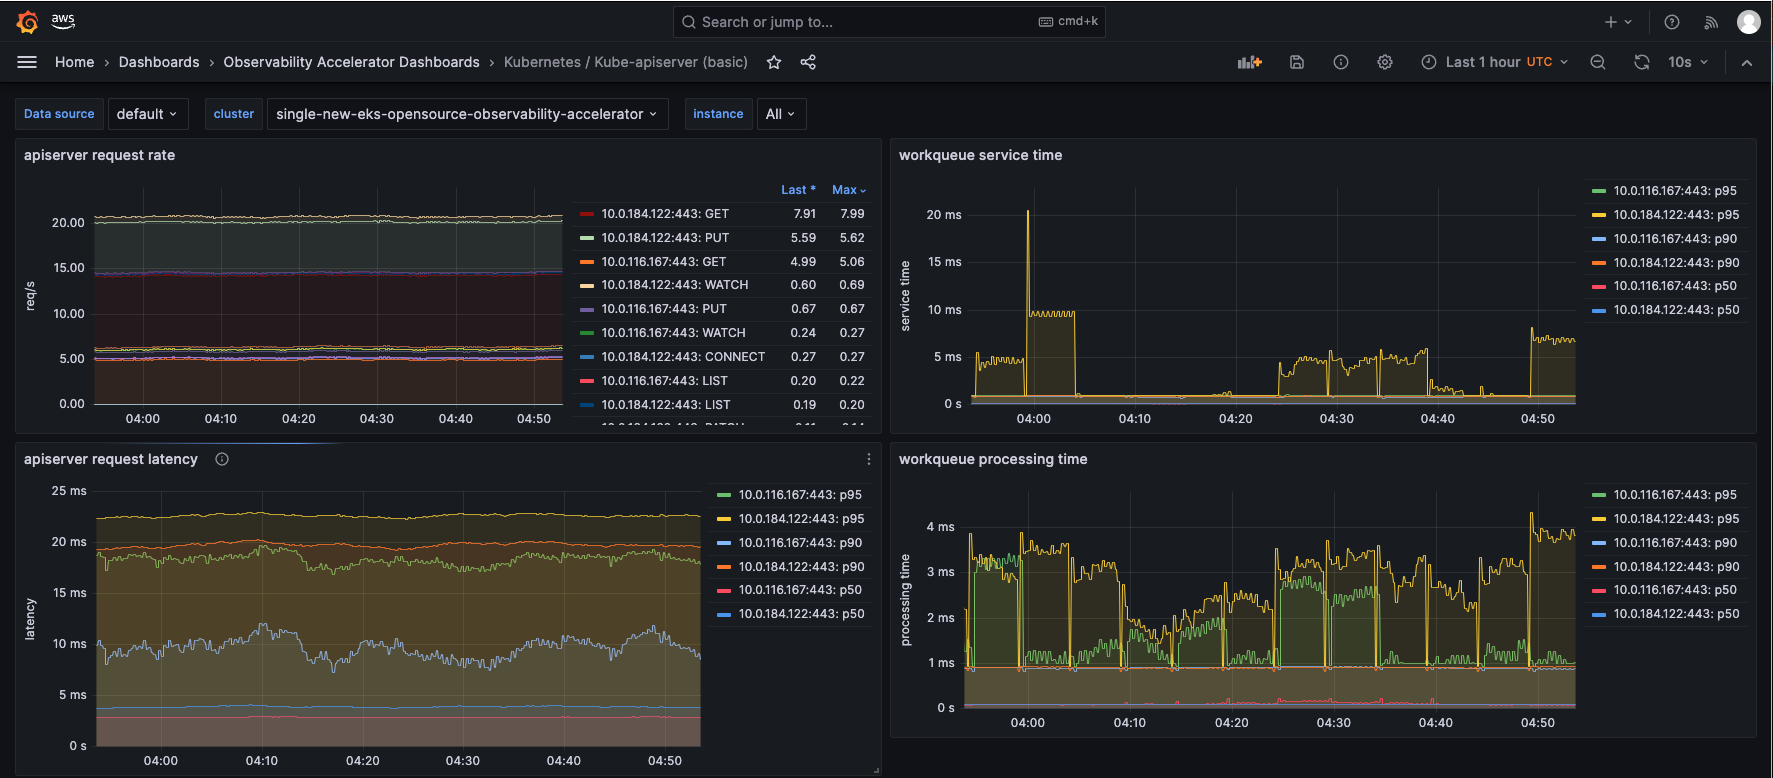
Open the Kubernetes/Kube-apiserver (basic) dashboard and you should be able to view its visualization as shown below:
Open the Kubernetes/Kube-apiserver (advanced) dashboard and you should be able to view its visualization as shown below:

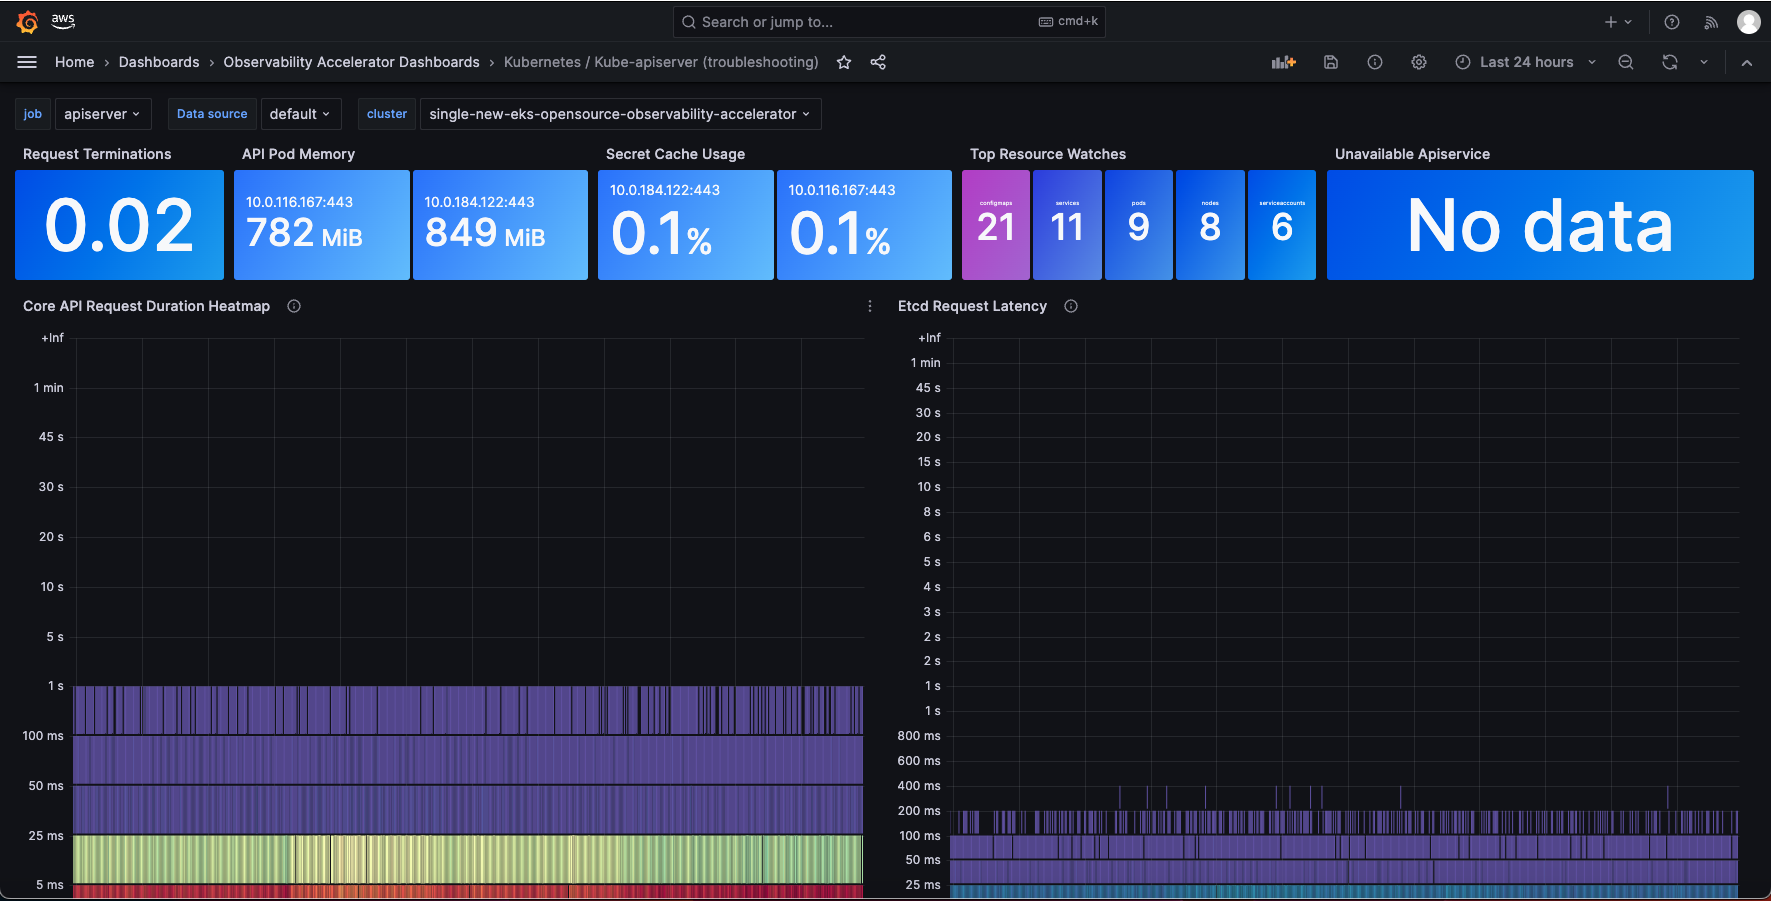
Open the Kubernetes/Kube-apiserver (troubleshooting) dashboard and you should be able to view its visualization as shown below:
Verify the resources
Please see Single New Nginx Observability Accelerator.
Teardown
You can teardown the whole CDK stack with the following command:
make pattern existing-eks-opensource-observability destroy
If you setup your cluster with Single New EKS Cluster Observability Accelerator, you also need to run:
make pattern single-new-eks-cluster destroy