Single Cluster Open Source Observability - NGINX Monitoring
Objective
This pattern demonstrates how to use the New EKS Cluster Open Source Observability Accelerator with Nginx based workloads.
It also enables control plane logging to provide comprehensive overview of cluster health.
Prerequisites
Ensure that you have installed the following tools on your machine.
Deploying
Please follow the Deploying instructions of the New EKS Cluster Open Source Observability Accelerator pattern, except for step 7, where you need to replace "context" in ~/.cdk.json with the following:
  "context": {
    "fluxRepository": {
      "name": "grafana-dashboards",
      "namespace": "grafana-operator",
      "repository": {
        "repoUrl": "https://github.com/aws-observability/aws-observability-accelerator",
        "name": "grafana-dashboards",
        "targetRevision": "main",
        "path": "./artifacts/grafana-operator-manifests/eks/infrastructure"
      },
      "values": {
        "GRAFANA_CLUSTER_DASH_URL" : "https://raw.githubusercontent.com/aws-observability/aws-observability-accelerator/main/artifacts/grafana-dashboards/eks/infrastructure/cluster.json",
        "GRAFANA_KUBELET_DASH_URL" : "https://raw.githubusercontent.com/aws-observability/aws-observability-accelerator/main/artifacts/grafana-dashboards/eks/infrastructure/kubelet.json",
        "GRAFANA_NSWRKLDS_DASH_URL" : "https://raw.githubusercontent.com/aws-observability/aws-observability-accelerator/main/artifacts/grafana-dashboards/eks/infrastructure/namespace-workloads.json",
        "GRAFANA_NODEEXP_DASH_URL" : "https://raw.githubusercontent.com/aws-observability/aws-observability-accelerator/main/artifacts/grafana-dashboards/eks/infrastructure/nodeexporter-nodes.json",
        "GRAFANA_NODES_DASH_URL" : "https://raw.githubusercontent.com/aws-observability/aws-observability-accelerator/main/artifacts/grafana-dashboards/eks/infrastructure/nodes.json",
        "GRAFANA_WORKLOADS_DASH_URL" : "https://raw.githubusercontent.com/aws-observability/aws-observability-accelerator/main/artifacts/grafana-dashboards/eks/infrastructure/workloads.json",
        "GRAFANA_NGINX_DASH_URL" : "https://raw.githubusercontent.com/aws-observability/aws-observability-accelerator/main/artifacts/grafana-dashboards/eks/nginx/nginx.json",
        "GRAFANA_KSH_DASH_URL" : "https://raw.githubusercontent.com/aws-observability/aws-observability-accelerator/main/artifacts/grafana-dashboards/eks/infrastructure/ksh.json",
        "GRAFANA_KCM_DASH_URL" : "https://raw.githubusercontent.com/aws-observability/aws-observability-accelerator/main/artifacts/grafana-dashboards/eks/infrastructure/kcm.json"
      },
      "kustomizations": [
        {
          "kustomizationPath": "./artifacts/grafana-operator-manifests/eks/infrastructure"
        },
        {
          "kustomizationPath": "./artifacts/grafana-operator-manifests/eks/nginx"
        }
      ]
    },
    "nginx.pattern.enabled": true
  }
!! warning This scenario might need larger worker node for the pod.
Once completed the rest of the Deploying steps, you can move on with the deployment of the Nginx workload.
Deploy an example Nginx application
In this section we will deploy sample application and extract metrics using AWS OpenTelemetry collector.
-
Add NGINX ingress controller add-on into lib/single-new-eks-opensource-observability-pattern/index.ts in add-on array.
const addOns: Array<blueprints.ClusterAddOn> = [ new blueprints.addons.CloudWatchLogsAddon({ logGroupPrefix: `/aws/eks/${stackId}`, logRetentionDays: 30 }), new blueprints.addons.XrayAdotAddOn(), new blueprints.addons.FluxCDAddOn({"repositories": [fluxRepository]}), new GrafanaOperatorSecretAddon(), new blueprints.addons.NginxAddOn({ name: "ingress-nginx", chart: "ingress-nginx", repository: "https://kubernetes.github.io/ingress-nginx", version: "4.7.2", namespace: "nginx-ingress-sample", values: { controller: { metrics: { enabled: true, service: { annotations: { "prometheus.io/port": "10254", "prometheus.io/scrape": "true" } } } } } }), ]; -
Deploy pattern again
make pattern single-new-eks-opensource-observability deploy -
Verify if the application is running
kubectl get pods -n nginx-ingress-sample -
Set an EXTERNAL-IP variable to the value of the EXTERNAL-IP column in the row of the NGINX ingress controller.
EXTERNAL_IP=$(kubectl get svc blueprints-addon-nginx-ingress-nginx-controller -n nginx-ingress-sample --output jsonpath='{.status.loadBalancer.ingress[0].hostname}') -
Start some sample NGINX traffic by entering the following command.
SAMPLE_TRAFFIC_NAMESPACE=nginx-sample-traffic
curl https://raw.githubusercontent.com/aws-observability/aws-observability-accelerator/main/artifacts/k8s-deployment-manifest-templates/nginx/nginx-traffic-sample.yaml |
sed "s/{{external_ip}}/$EXTERNAL_IP/g" |
sed "s/{{namespace}}/$SAMPLE_TRAFFIC_NAMESPACE/g" |
kubectl apply -f -
Verify the resources
kubectl get pod -n nginx-sample-traffic
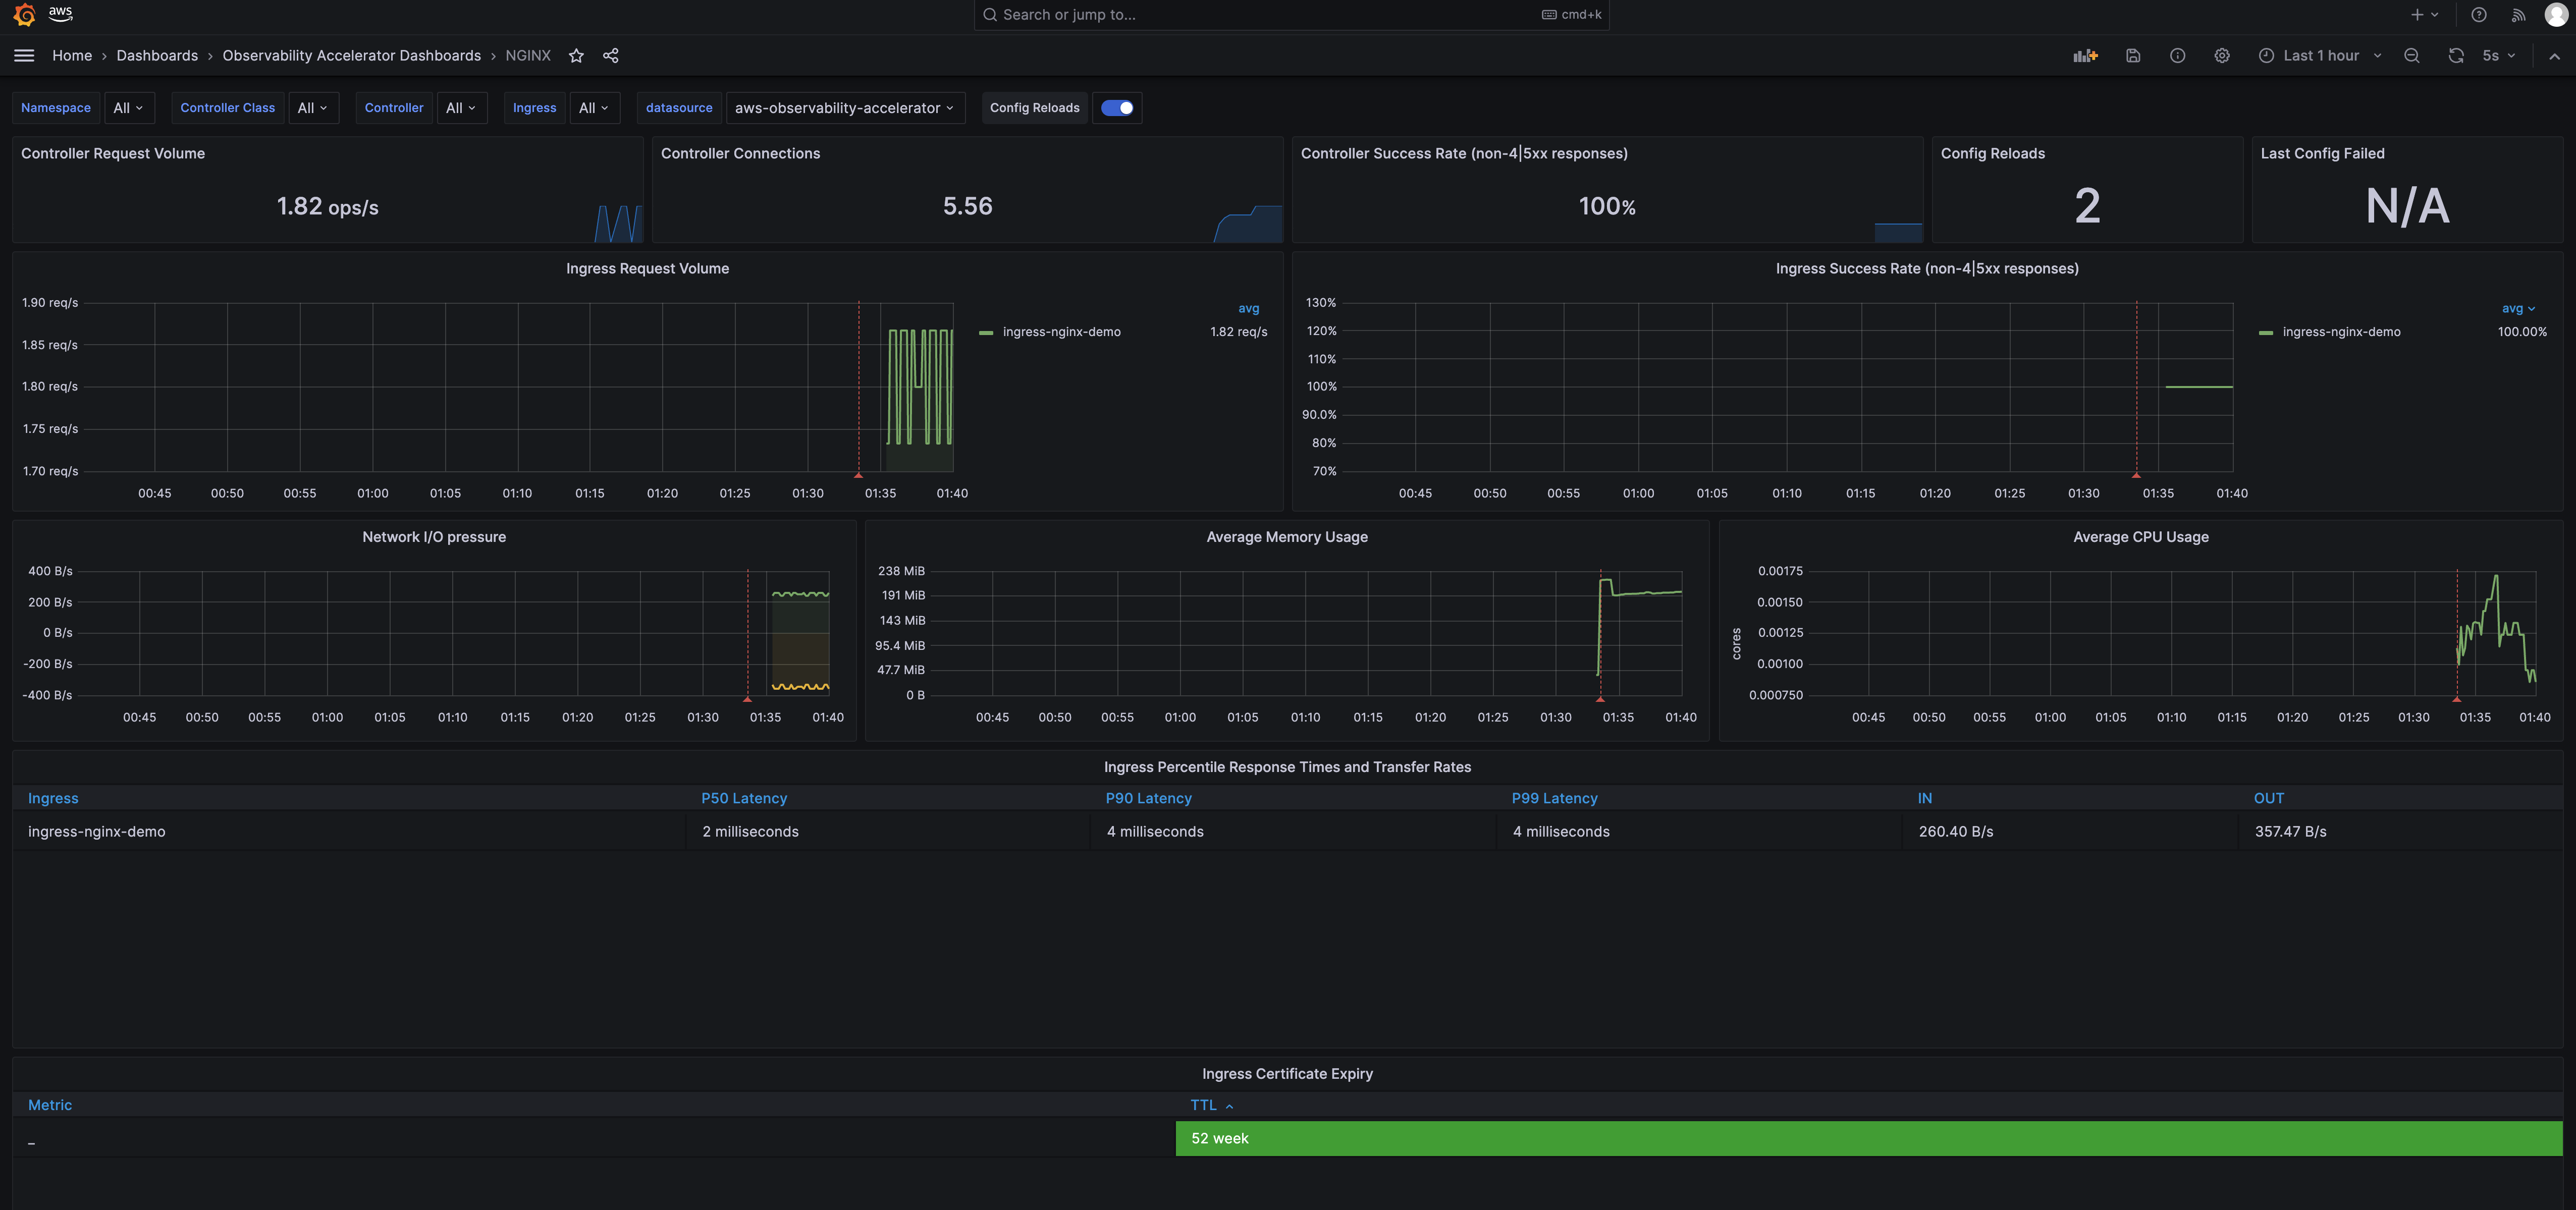
Visualization
Login to your Grafana workspace and navigate to the Dashboards panel. You should see a new dashboard named NGINX, under Observability Accelerator Dashboards.
Teardown
You can teardown the whole CDK stack with the following command:
make pattern single-new-eks-opensource-observability destroy