Using GitOps and Grafana Operator with Amazon Managed Grafana
How to use this guide
This Observability best practices guide is meant for developers and architects who want to understand how to use grafana-operator as a Kubernetes operator on your Amazon EKS cluster to create and manage the lifecycle of Grafana resources and Grafana dashboards in Amazon Managed Grafana in a Kubernetes native way.
Introduction
Customers use Grafana as an observability platform for open source analytics and monitoring solution. We have seen customers running their workloads in Amazon EKS want to shift their focus towards workload gravity and rely on Kubernetes-native controllers to deploy and manage the lifecycle of external resources such as Cloud resources. We have seen customers installing AWS Controllers for Kubernetes (ACK) to create, deploy and manage AWS services. Many customers these days opt to offload the Prometheus and Grafana implementations to managed services and in case of AWS these services are Amazon Managed Service for Prometheus and Amazon Managed Grafana for monitoring their workloads.
One common challenge customers face while using Grafana is, in creating and managing the lifecycle of Grafana resources and Grafana dashboards in external Grafana instances such as Amazon Managed Grafana from their Kubernetes cluster. Customers face challenges in finding ways to completely automate and manage infrastructure and application deployment of their whole system using Git based workflows which also includes creating of Grafana resources in Amazon Managed Grafana. In this Observability best practices guide, we will focus on the following topics:
- Introduction on Grafana Operator - A Kubernetes operator to manage external Grafana instances from your Kubernetes cluster
- Introduction to GitOps - Automated mechanisms to create and manage your infrastructure using Git based workflows
- Using Grafana Operator on Amazon EKS to manage Amazon Managed Grafana
- Using GitOps with Flux on Amazon EKS to manage Amazon Managed Grafana
Introduction on Grafana Operator
The grafana-operator is a Kubernetes operator built to help you manage your Grafana instances inside Kubernetes. Grafana Operator makes it possible for you to manage and create Grafana dashboards, datasources etc. declaratively between multiple instances in an easy and scalable way. The Grafana operator now supports managing resources such as dashboards, datasources etc hosted on external environments like Amazon Managed Grafana. This ultimately enables us to use GitOps mechanisms using CNCF projects such as Flux to create and manage the lifecyle of resources in Amazon Managed Grafana from Amazon EKS cluster.
Introduction to GitOps
What is GitOps and Flux
GitOps is a software development and operations methodology that uses Git as the source of truth for deployment configurations. It involves keeping the desired state of an application or infrastructure in a Git repository and using Git-based workflows to manage and deploy changes. GitOps is a way of managing application and infrastructure deployment so that the whole system is described declaratively in a Git repository. It is an operational model that offers you the ability to manage the state of multiple Kubernetes clusters leveraging the best practices of version control, immutable artifacts, and automation.
Flux is a GitOps tool that automates the deployment of applications on Kubernetes. It works by continuously monitoring the state of a Git repository and applying any changes to a cluster. Flux integrates with various Git providers such as GitHub, GitLab, and Bitbucket. When changes are made to the repository, Flux automatically detects them and updates the cluster accordingly.
Advantages of using Flux
- Automated deployments: Flux automates the deployment process, reducing manual errors and freeing up developers to focus on other tasks.
- Git-based workflow: Flux leverages Git as a source of truth, which makes it easier to track and revert changes.
- Declarative configuration: Flux uses Kubernetes manifests to define the desired state of a cluster, making it easier to manage and track changes.
Challenges in adopting Flux
- Limited customization: Flux only supports a limited set of customizations, which may not be suitable for all use cases.
- Steep learning curve: Flux has a steep learning curve for new users and requires a deep understanding of Kubernetes and Git.
Using Grafana Operator on Amazon EKS to manage resources in Amazon Managed Grafana
As discussed in previous section, Grafana Operator enables us to use our Kubernetes cluster to create and manage the lifecyle of resources in Amazon Managed Grafana in a Kubernetes native way. The below architecture diagram shows the demonstration of Kubernetes cluster as a control plane with using Grafana Operator to setup an identity with AMG, adding Amazon Managed Service for Prometheus as a data source and creating dashboards on Amazon Managed Grafana from Amazon EKS cluster in a Kubernetes native way.
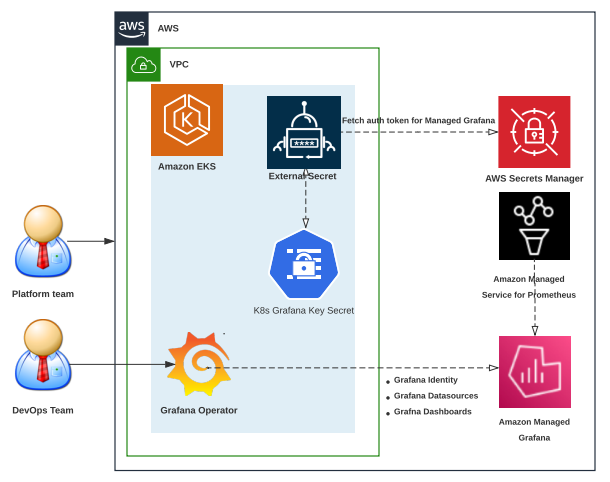
Please refer to our post on Using Open Source Grafana Operator on your Kubernetes cluster to manage Amazon Managed Grafana for detailed demonstration of how to deploy the above solution on your Amazon EKS cluster.
Using GitOps with Flux on Amazon EKS to manage resources in Amazon Managed Grafana
As discussed above, Flux automates the deployment of applications on Kubernetes. It works by continuously monitoring the state of a Git repository such as GitHub and when changes are made to the repository, Flux automatically detects them and updates the cluster accordingly. Please reference the below architecture where we will be demonstrating how to use Grafana Operator from your Kubernetes cluster and GitOps mechanisms using Flux to add Amazon Managed Service for Prometheus as a data source and create dashboards in Amazon Managed Grafana in a Kubernetes native way.
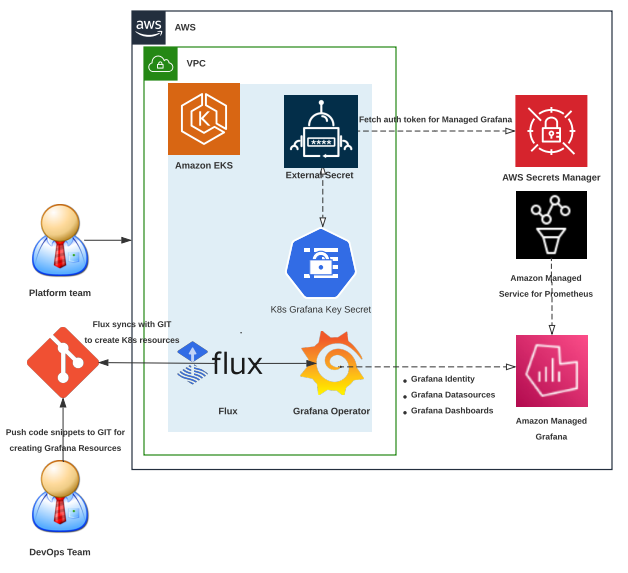
Please refer to our One Observability Workshop module - GitOps with Amazon Managed Grafana. This module sets up required "Day 2" operational tooling such as the following on your EKS cluster:
- External Secrets Operator is installed successfully to read Amazon Managed Grafana secrets from AWS Secret Manager
- Prometheus Node Exporterto measure various machine resources such as memory, disk and CPU utilization
- Grafana Operator to use our Kubernetes cluster to create and manage the lifecyle of resources in Amazon Managed Grafana in a Kubernetes native way.
- Flux to automate the deployment of applications on Kubernetes using GitOps mechanisms.
Conclusion
In this section of Observability best practices guide, we learned about using Grafana Operator and GitOps with Amazon Managed Grafana. We started with learning about GitOps and Grafana Operator. Then we focussed on how to use Grafana Operator on Amazon EKS to manage resources in Amazon Managed Grafana and on how to use GitOps with Flux on Amazon EKS to manage resources in Amazon Managed Grafana to setup an identity with AMG, adding AWS data sources on Amazon Managed Grafana from Amazon EKS cluster in a Kubernetes native way.